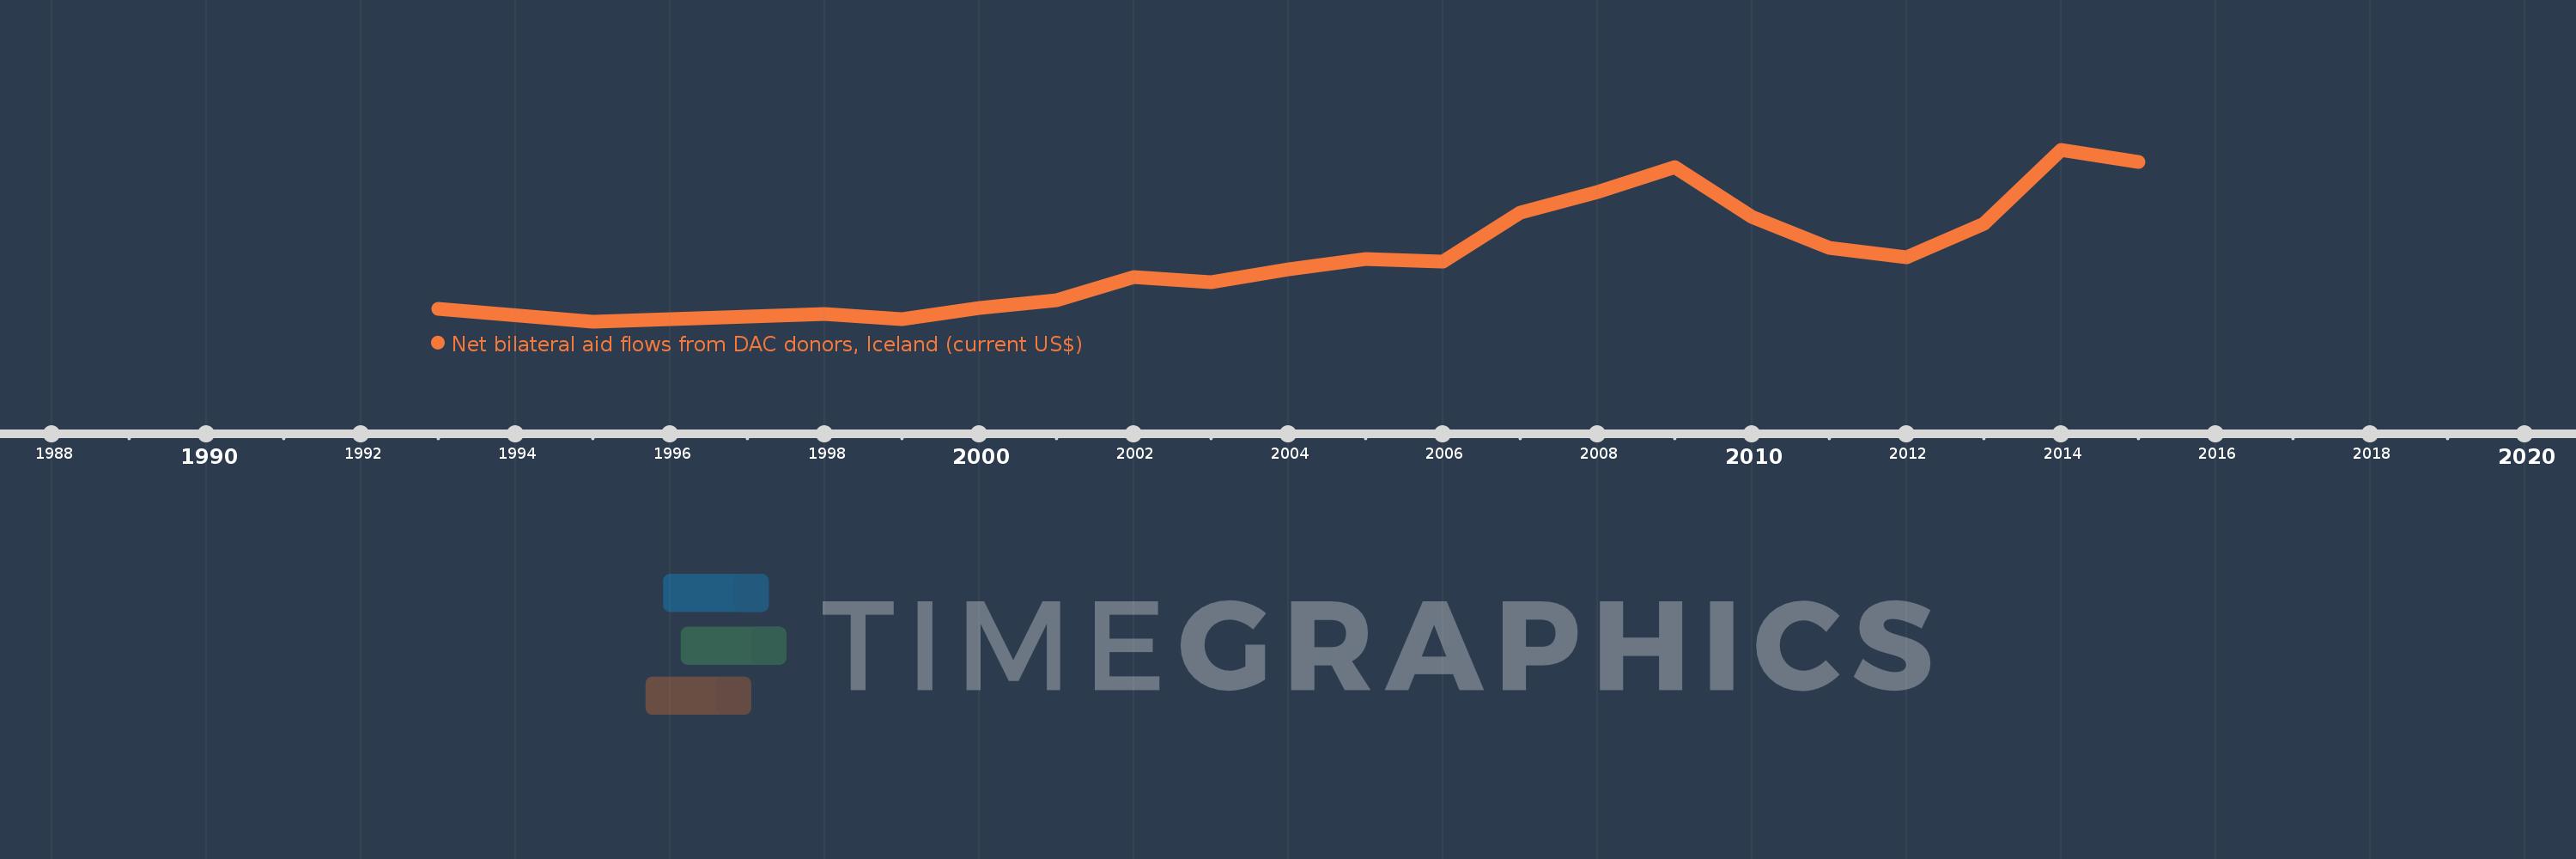
This timeline shows a graph from 1993 to 2015 of Malawi. No data until 1992. Number of actual observations by date: 20.
Source name:
World Development Indicators
Source organization:
Development Assistance Committee of the Organisation for Economic Co-operation and Development, Geographical Distribution of Financial Flows to Developing Countries, Development Co-operation Report, and International Development Statistics database. Data are available online at: www.oecd.org/dac/stats/idsonline.
Categories, topics:
Aid Effectiveness
Last updated:
apr 23, 2017
Indicators value changes by year
Meaning:
2.491 mln
Minimum:
340.0K
jan 1, 1995
Maximum:
5.66 mln
jan 1, 2014
At the date of observation
Value
Absolute change
Change from the previous value
jan 1, 1993
750.0K
+750.0K
0.0%
jan 1, 1995
340.0K
-410.0K
-54.67%
jan 1, 1998
600.0K
+260.0K
76.47%
jan 1, 1999
440.0K
-160.0K
-26.67%
jan 1, 2000
770.0K
+330.0K
75.0%
jan 1, 2001
1.02 mln
+250.0K
32.47%
jan 1, 2002
1.74 mln
+720.0K
70.59%
jan 1, 2003
1.57 mln
-170.0K
-9.77%
jan 1, 2004
1.96 mln
+390.0K
24.84%
jan 1, 2005
2.28 mln
+320.0K
16.33%
jan 1, 2006
2.21 mln
-70.0K
-3.07%
jan 1, 2007
3.73 mln
+1.52 mln
68.78%
jan 1, 2008
4.37 mln
+640.0K
17.16%
jan 1, 2009
5.13 mln
+760.0K
17.39%
jan 1, 2010
3.6 mln
-1.53 mln
-29.82%
jan 1, 2011
2.63 mln
-970.0K
-26.94%
jan 1, 2012
2.35 mln
-280.0K
-10.65%
jan 1, 2013
3.38 mln
+1.03 mln
43.83%
jan 1, 2014
5.66 mln
+2.28 mln
67.46%
jan 1, 2015
5.29 mln
-370.0K
-6.54%
Ranking of countries by current statistics by years