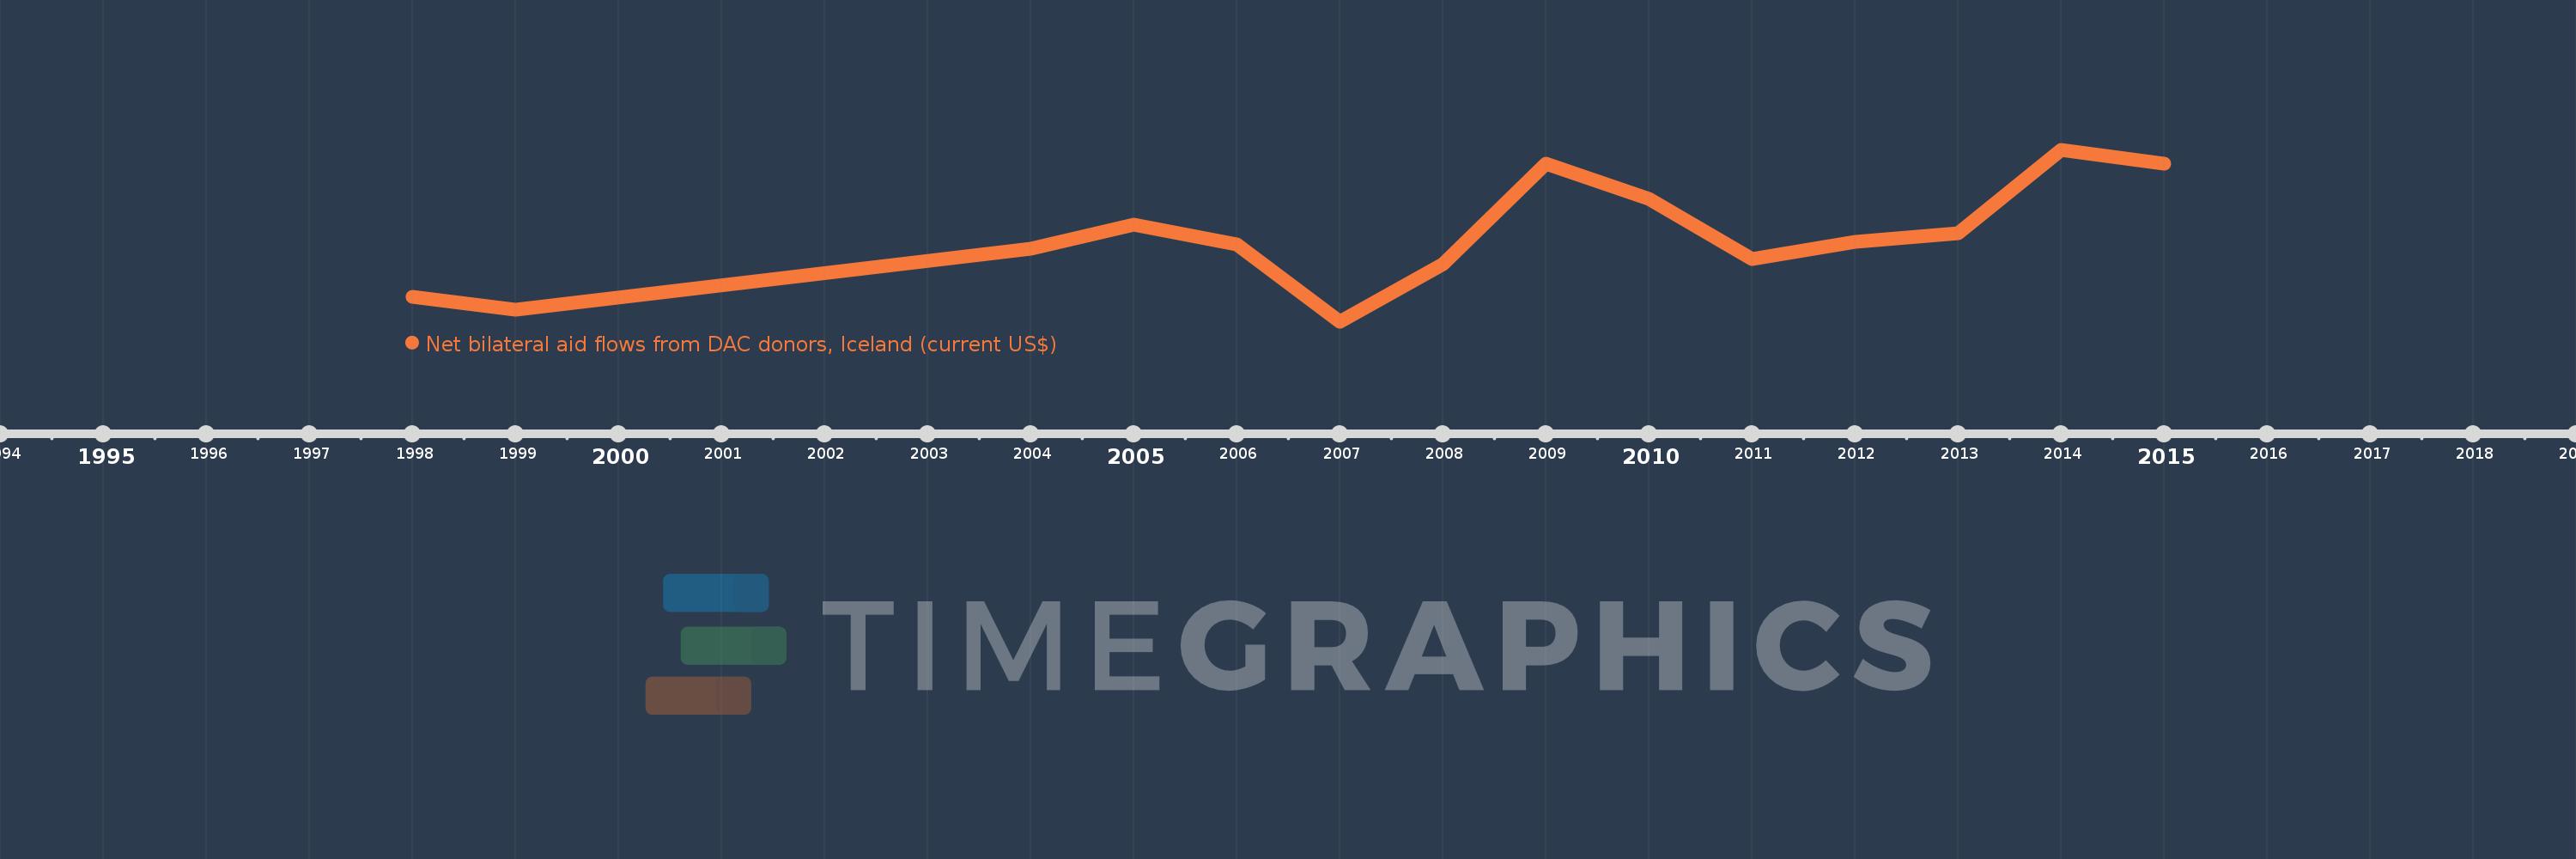
This timeline shows a graph from 1998 to 2015 of Arab World. No data until 1997. Number of actual observations by date: 14.
Source name:
World Development Indicators
Source organization:
Development Assistance Committee of the Organisation for Economic Co-operation and Development, Geographical Distribution of Financial Flows to Developing Countries, Development Co-operation Report, and International Development Statistics database. Data are available online at: www.oecd.org/dac/stats/idsonline.
Categories, topics:
Aid Effectiveness
Last updated:
apr 23, 2017
Indicators value changes by year
Meaning:
1.359 mln
Minimum:
140.0K
jan 1, 2007
Maximum:
2.61 mln
jan 1, 2014
At the date of observation
Value
Absolute change
Change from the previous value
jan 1, 1998
500.0K
+500.0K
0.0%
jan 1, 1999
320.0K
-180.0K
-36.0%
jan 1, 2004
1.19 mln
+870.0K
271.88%
jan 1, 2005
1.54 mln
+350.0K
29.41%
jan 1, 2006
1.26 mln
-280.0K
-18.18%
jan 1, 2007
140.0K
-1.12 mln
-88.89%
jan 1, 2008
970.0K
+830.0K
592.86%
jan 1, 2009
2.42 mln
+1.45 mln
149.48%
jan 1, 2010
1.91 mln
-510.0K
-21.07%
jan 1, 2011
1.05 mln
-860.0K
-45.03%
jan 1, 2012
1.29 mln
+240.0K
22.86%
jan 1, 2013
1.41 mln
+120.0K
9.3%
jan 1, 2014
2.61 mln
+1.2 mln
85.11%
jan 1, 2015
2.41 mln
-200.0K
-7.66%
Ranking of countries by current statistics by years