33
/
AIzaSyB4mHJ5NPEv-XzF7P6NDYXjlkCWaeKw5bc
November 30, 2025
50144
Middle East & North Africa (IDA & IBRD countries)
TMN
false
2
1
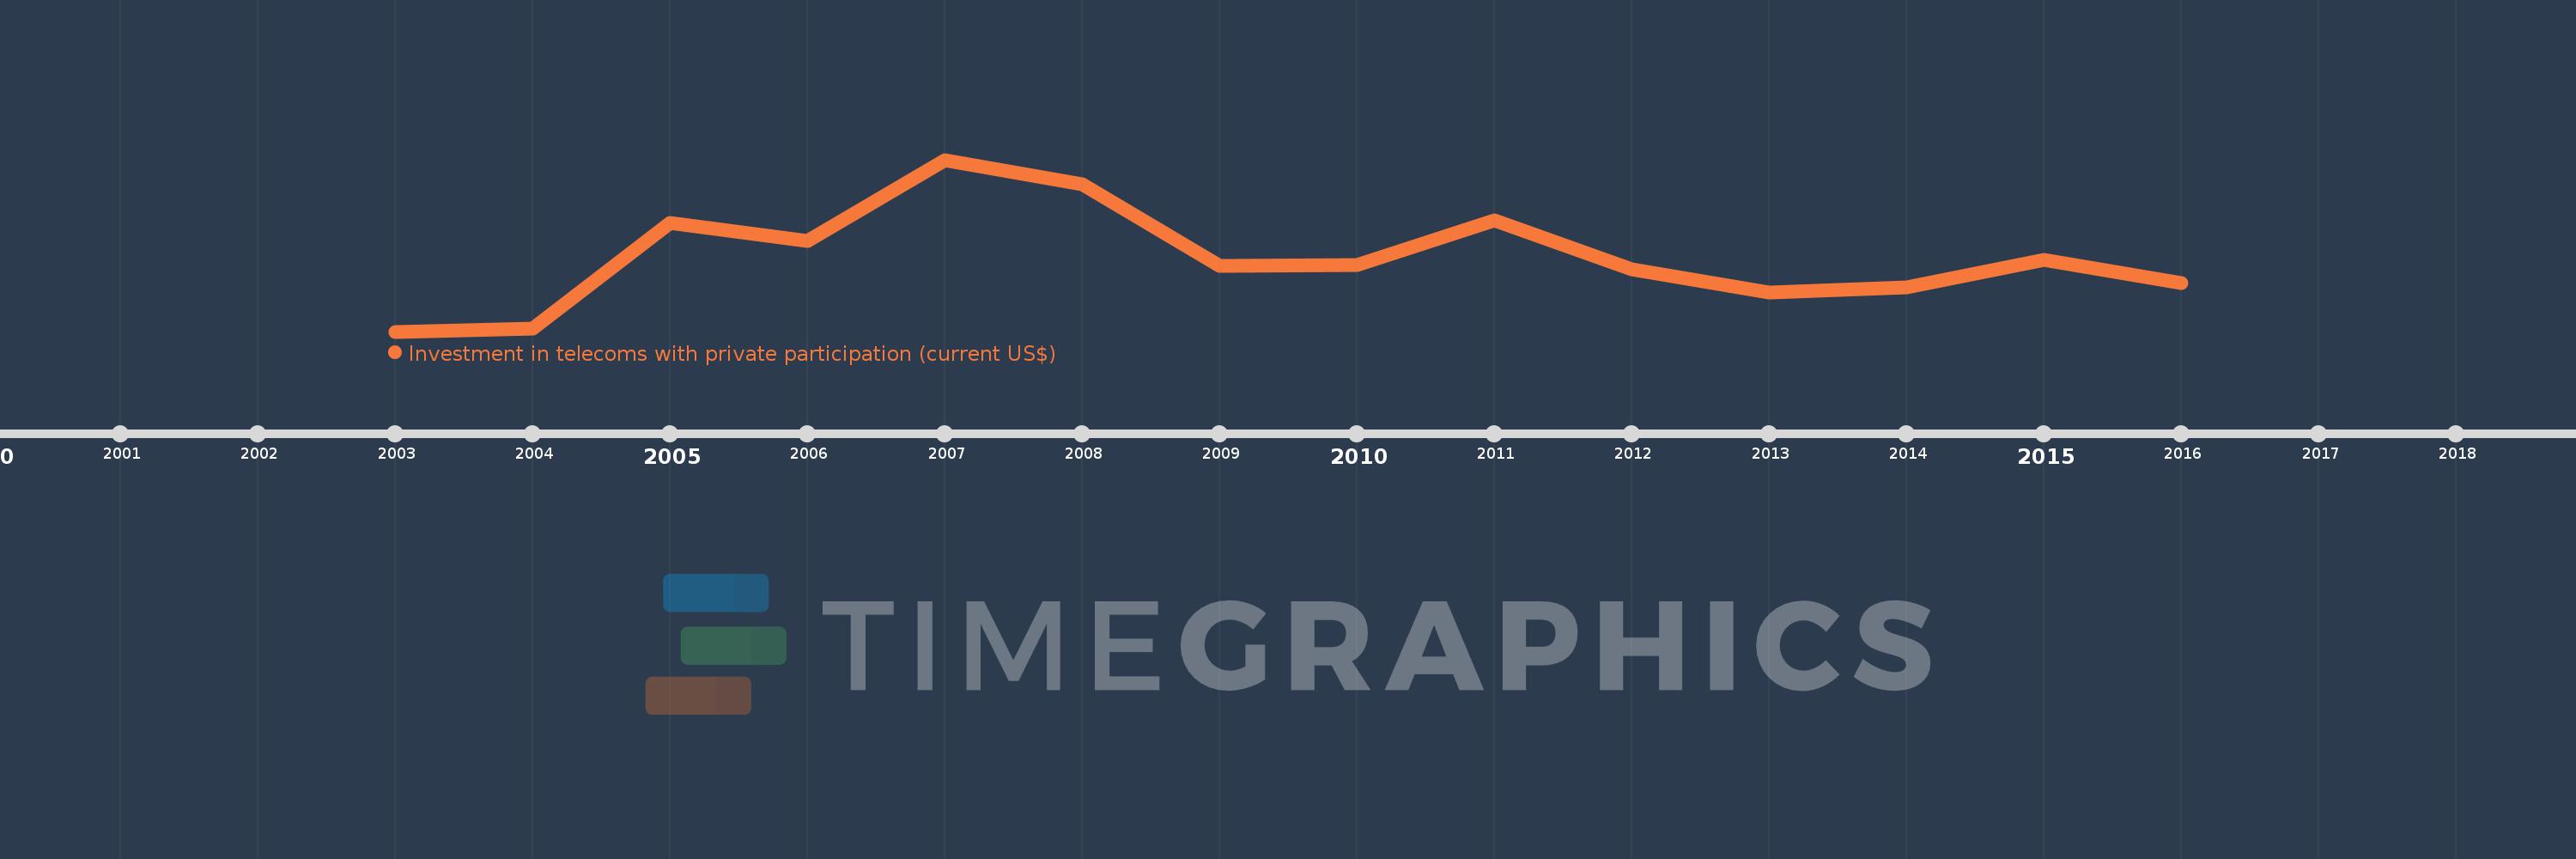
Investment in telecoms with private participation (current US$)
2016,2015,2014,2013,2012,2011,2010,2009,2008,2007,2006,2005,2004,2003