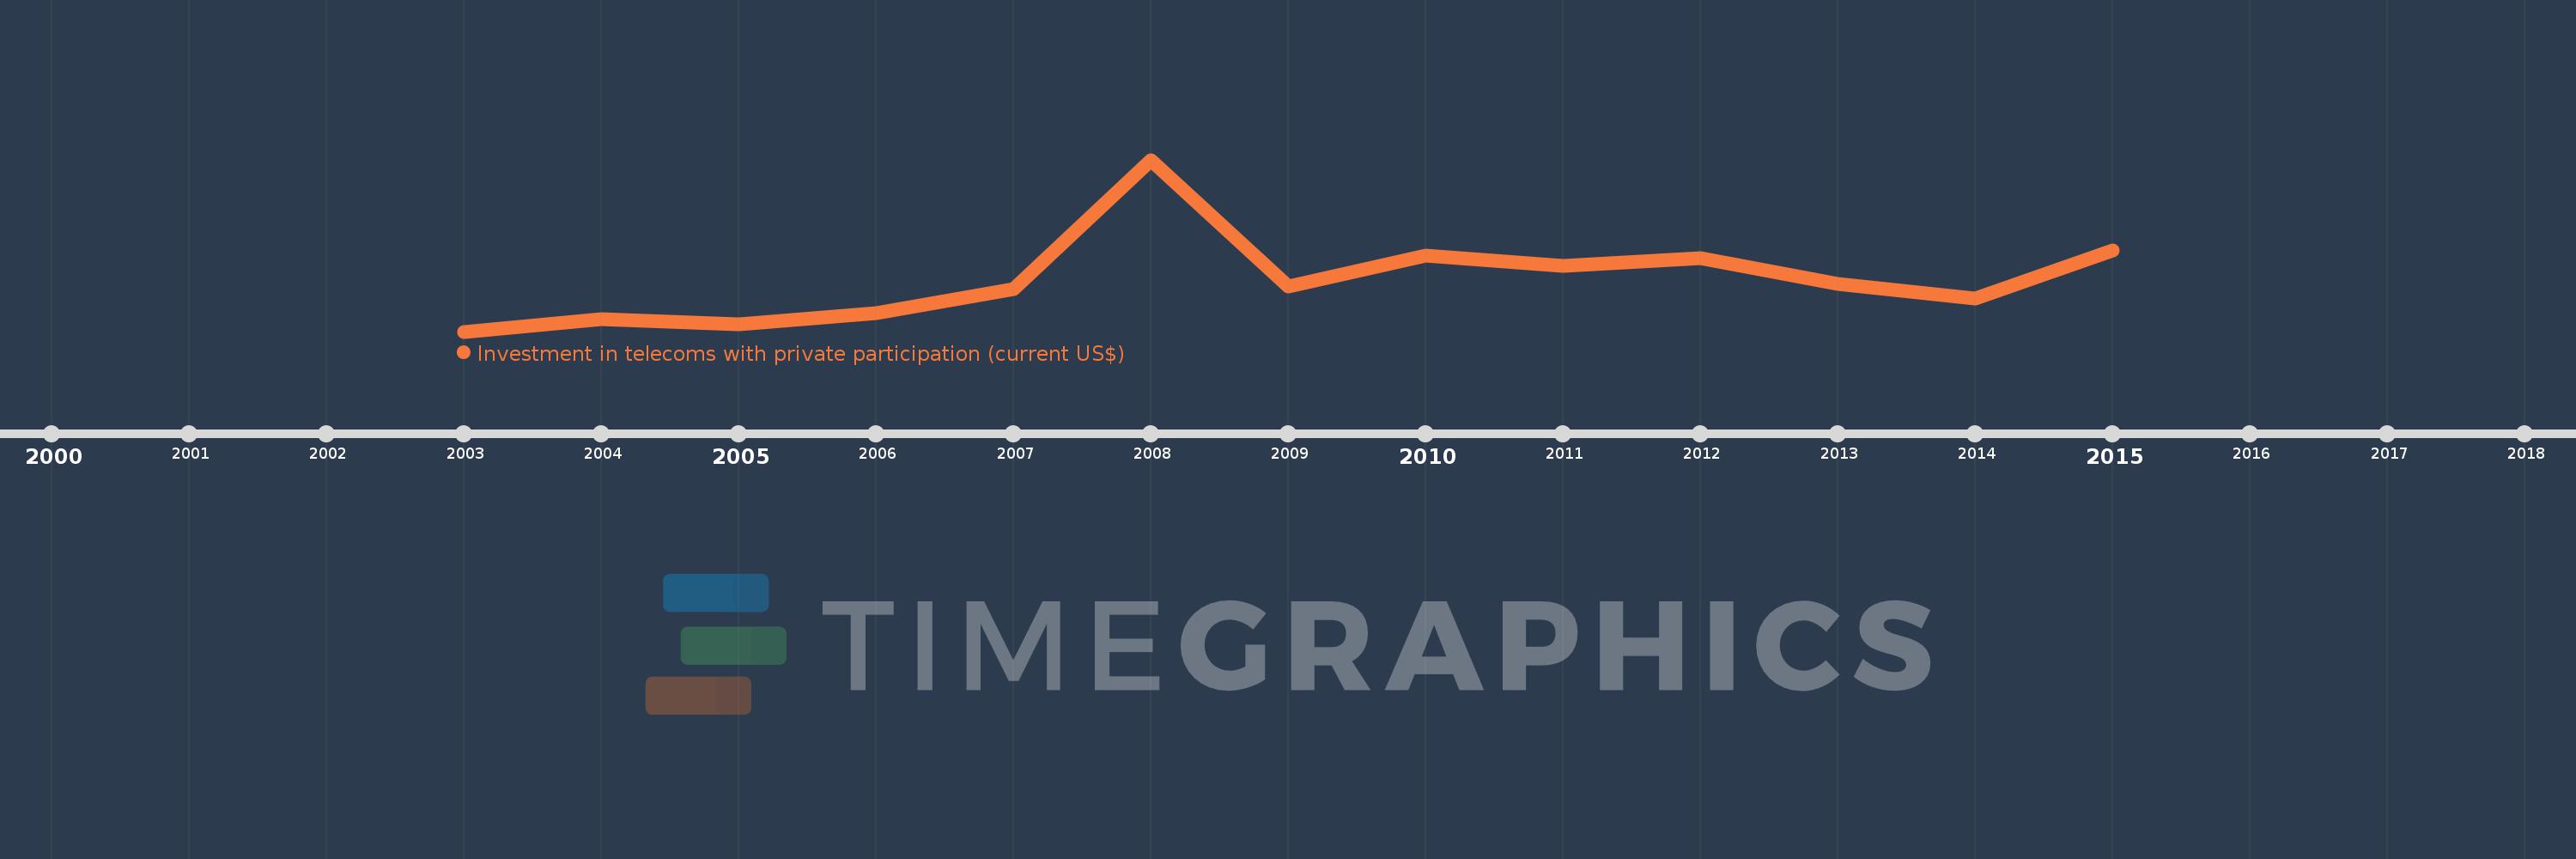
This timeline shows a graph from 2003 to 2015 of Fragile and conflict affected situations. No data until 2002. Number of actual observations by date: 13.
Source name:
World Development Indicators
Source organization:
World Bank, Private Participation in Infrastructure Project Database (http://ppi.worldbank.org).
Categories, topics:
Infrastructure, Private Sector
Last updated:
apr 23, 2017
Indicators value changes by year
Meaning:
2.286 bln
Minimum:
629.55 mln
jan 1, 2003
Maximum:
6.121 bln
jan 1, 2008
At the date of observation
Value
Absolute change
Change from the previous value
jan 1, 2003
629.55 mln
+629.55 mln
0.0%
jan 1, 2004
1.025 bln
+395.0 mln
62.74%
jan 1, 2005
860.85 mln
-163.7 mln
-15.98%
jan 1, 2006
1.23 bln
+368.95 mln
42.86%
jan 1, 2007
1.981 bln
+751.63 mln
61.12%
jan 1, 2008
6.121 bln
+4.139 bln
208.91%
jan 1, 2009
2.066 bln
-4.055 bln
-66.24%
jan 1, 2010
3.056 bln
+989.65 mln
47.9%
jan 1, 2011
2.717 bln
-338.8 mln
-11.09%
jan 1, 2012
2.984 bln
+267.2 mln
9.83%
jan 1, 2013
2.16 bln
-824.3 mln
-27.62%
jan 1, 2014
1.676 bln
-483.7 mln
-22.39%
jan 1, 2015
3.217 bln
+1.541 bln
91.93%
Ranking of countries by current statistics by years