33
/
AIzaSyB4mHJ5NPEv-XzF7P6NDYXjlkCWaeKw5bc
November 30, 2025
186706
Malawi
MWI
true
2
1
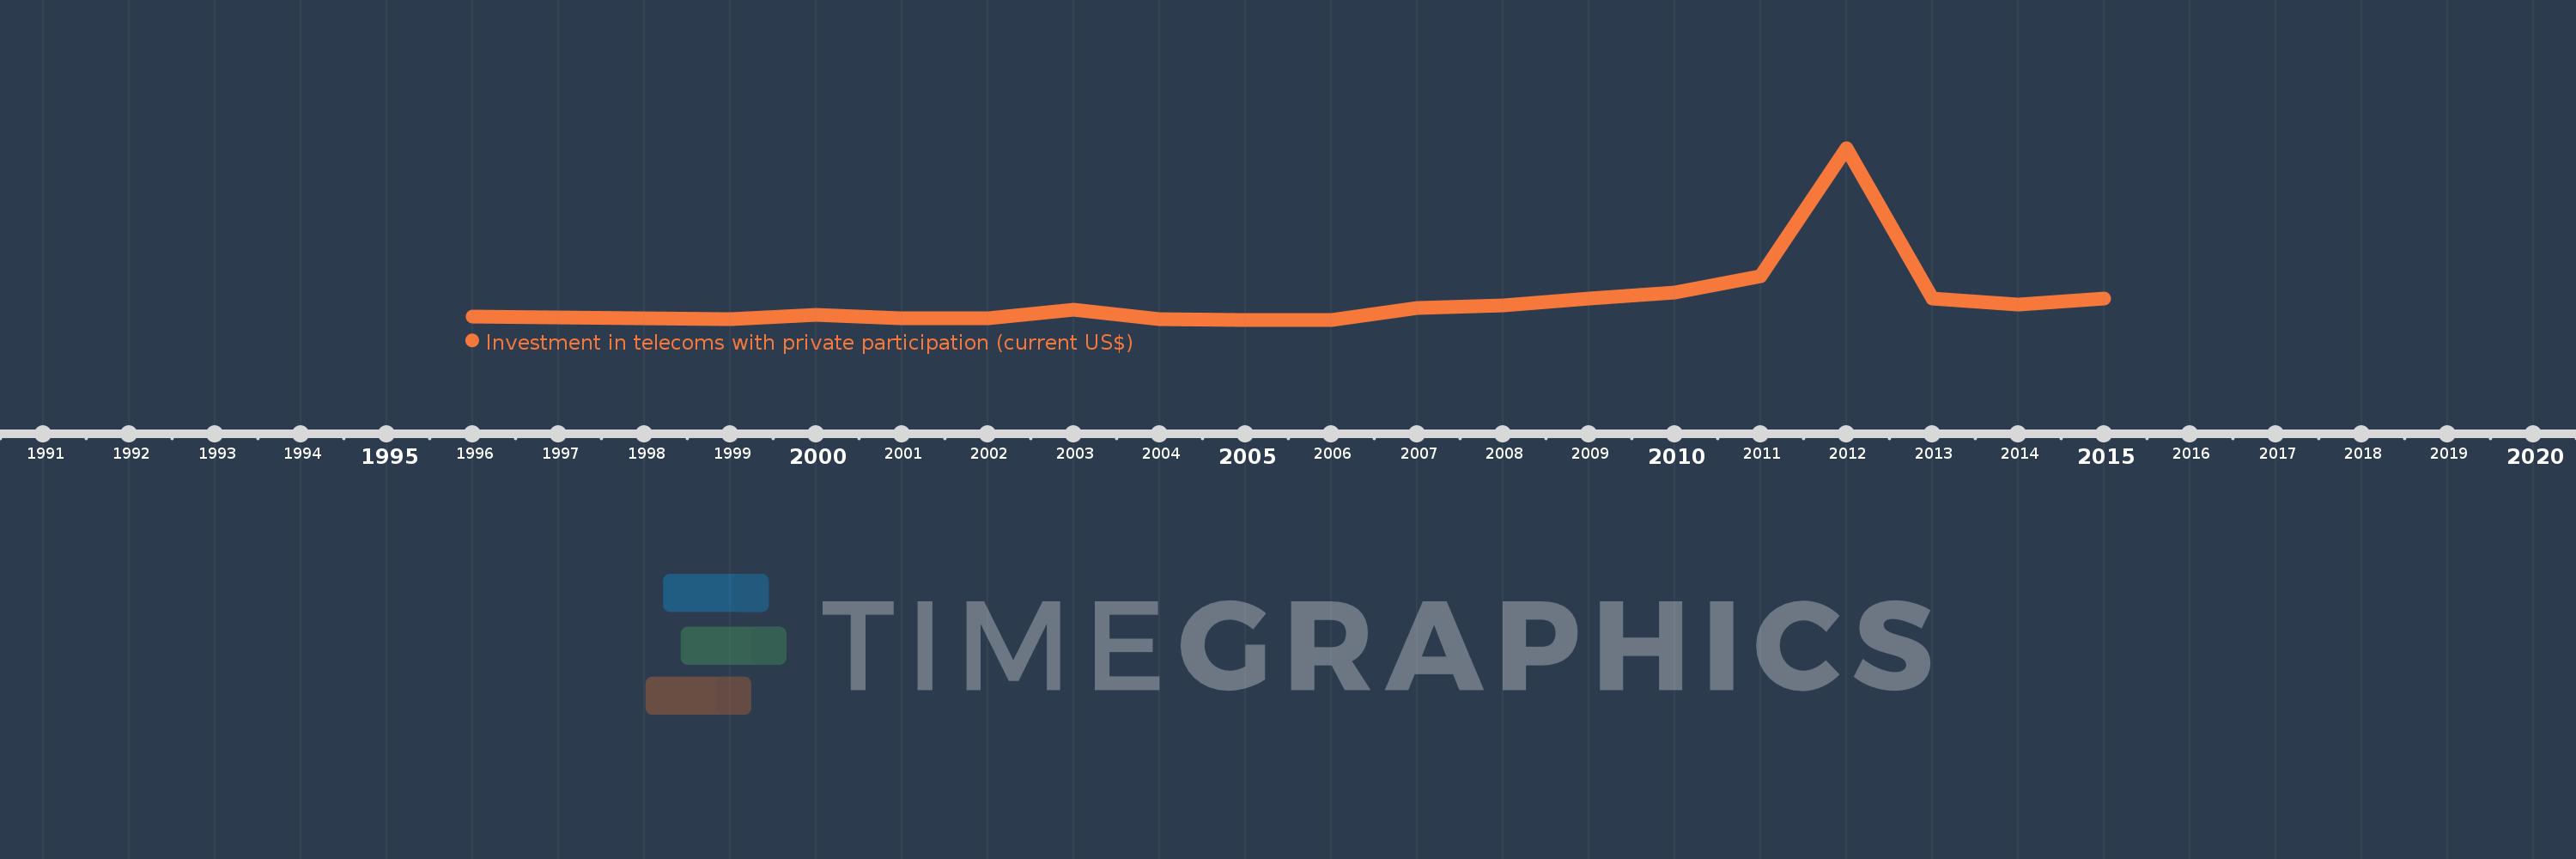
Investment in telecoms with private participation (current US$)
2015,2014,2013,2012,2011,2010,2009,2008,2007,2006,2005,2004,2003,2002,2001,2000,1999,1996
Create a timeline
Public Timelines
For education
For educational institutions
For teachers
For students
Cabinet
For educational institutions
For teachers
For students
Open cabinet
FAQ
Close
Create a timeline
Public timelines
FAQ
About & Feedback
Terms
Privacy
FAQ
Support 24/7
Cabinet
Get premium
Donate
Download
Global statistics library
→
Malawi
→
Investment in telecoms with private participation (current US$)
This statistics in other country:
Afghanistan
Albania
Algeria
American Samoa
Angola
Antigua and Barbuda
Argentina
Armenia
Azerbaijan
Bangladesh
Belarus
Belize
Benin
Bhutan
Bolivia
Bosnia and Herzegovina
Botswana
Brazil
Bulgaria
Burkina Faso
Burundi
Cabo Verde
Cambodia
Cameroon
Central African Republic
Chad
Chile
China
Colombia
Congo, Dem. Rep.
Congo, Rep.
Costa Rica
Cote d'Ivoire
Cuba
Dominica
Dominican Republic
Early-demographic dividend
East Asia & Pacific (excluding high income)
East Asia & Pacific (IDA & IBRD countries)
Ecuador
Egypt, Arab Rep.
El Salvador
Eritrea
Ethiopia
Europe & Central Asia (excluding high income)
Europe & Central Asia (IDA & IBRD countries)
Fiji
Fragile and conflict affected situations
Gabon
Gambia, The
Georgia
Ghana
Grenada
Guatemala
Guinea
Guinea-Bissau
Guyana
Haiti
Heavily indebted poor countries (HIPC)
Honduras
IBRD only
IDA & IBRD total
IDA blend
IDA only
IDA total
India
Indonesia
Iran, Islamic Rep.
Iraq
Jamaica
Jordan
Kazakhstan
Kenya
Kiribati
Korea, Dem. People’s Rep.
Kosovo
Kyrgyz Republic
Lao PDR
Late-demographic dividend
Latin America & Caribbean
Latin America & Caribbean (excluding high income)
Latin America & the Caribbean (IDA & IBRD countries)
Least developed countries: UN classification
Lebanon
Lesotho
Liberia
Lithuania
Low & middle income
Low income
Lower middle income
Macedonia, FYR
Madagascar
Malawi
Malaysia
Maldives
Mali
Mauritania
Mauritius
Mexico
Micronesia, Fed. Sts.
Middle East & North Africa (excluding high income)
Middle East & North Africa (IDA & IBRD countries)
Middle income
Moldova
Mongolia
Montenegro
Morocco
Mozambique
Myanmar
Namibia
Nepal
Nicaragua
Niger
Nigeria
Other small states
Pacific island small states
Pakistan
Panama
Papua New Guinea
Paraguay
Peru
Philippines
Pre-demographic dividend
Romania
Russian Federation
Rwanda
Samoa
Senegal
Serbia
Seychelles
Sierra Leone
Somalia
South Africa
South Asia
South Asia (IDA & IBRD)
South Sudan
Sri Lanka
St. Kitts and Nevis
St. Lucia
St. Vincent and the Grenadines
Sub-Saharan Africa
Sub-Saharan Africa (excluding high income)
Sub-Saharan Africa (IDA & IBRD countries)
Sudan
Suriname
Swaziland
Syrian Arab Republic
Tajikistan
Tanzania
Thailand
Timor-Leste
Togo
Tonga
Tunisia
Turkey
Turkmenistan
Uganda
Ukraine
Upper middle income
Uruguay
Uzbekistan
Vanuatu
Venezuela, RB
Vietnam
West Bank and Gaza
Yemen, Rep.
Zambia
Zimbabwe
Timeline:
This timeline shows a graph from
1996
to
2015
of Malawi. No data until
1995
. Number of actual observations by date:
18
.
Source name:
World Development Indicators
Source organization:
World Bank, Private Participation in Infrastructure Project Database (http://ppi.worldbank.org).
Categories, topics:
Infrastructure, Private Sector
Last updated:
apr 23, 2017
Indicators value changes by year
Meaning:
54.45 mln
Minimum:
0.0
jan 1, 2005
Maximum:
455.4 mln
jan 1, 2012
At the date of observation
Value
Absolute change
Change from the previous value
jan 1, 1996
8.0 mln
+8.0 mln
0.0%
jan 1, 1999
2.0 mln
-6.0 mln
-75.0%
jan 1, 2000
13.1 mln
+11.1 mln
555.0%
jan 1, 2001
4.7 mln
-8.4 mln
-64.12%
jan 1, 2002
4.7 mln
0.0
0.0%
jan 1, 2003
26.0 mln
+21.3 mln
453.19%
jan 1, 2004
900.0K
-25.1 mln
-96.54%
jan 1, 2005
0.0
-900.0K
-100.0%
jan 1, 2006
0.0
0.0
%
jan 1, 2007
30.5 mln
+30.5 mln
%
jan 1, 2008
37.0 mln
+6.5 mln
21.31%
jan 1, 2009
57.2 mln
+20.2 mln
54.59%
jan 1, 2010
73.0 mln
+15.8 mln
27.62%
jan 1, 2011
116.0 mln
+43.0 mln
58.9%
jan 1, 2012
455.4 mln
+339.4 mln
292.59%
jan 1, 2013
56.3 mln
-399.1 mln
-87.64%
jan 1, 2014
39.3 mln
-17.0 mln
-30.2%
jan 1, 2015
56.0 mln
+16.7 mln
42.49%
Ranking of countries by current statistics by years
About & Feedback
Terms
Privacy
FAQ
Support 24/7
Cabinet
Get premium
Donate
The service accepts bank transfer (ACH, Wire) or cards (Visa, MasterCard, etc). Processed by Stripe.
Secured with SSL