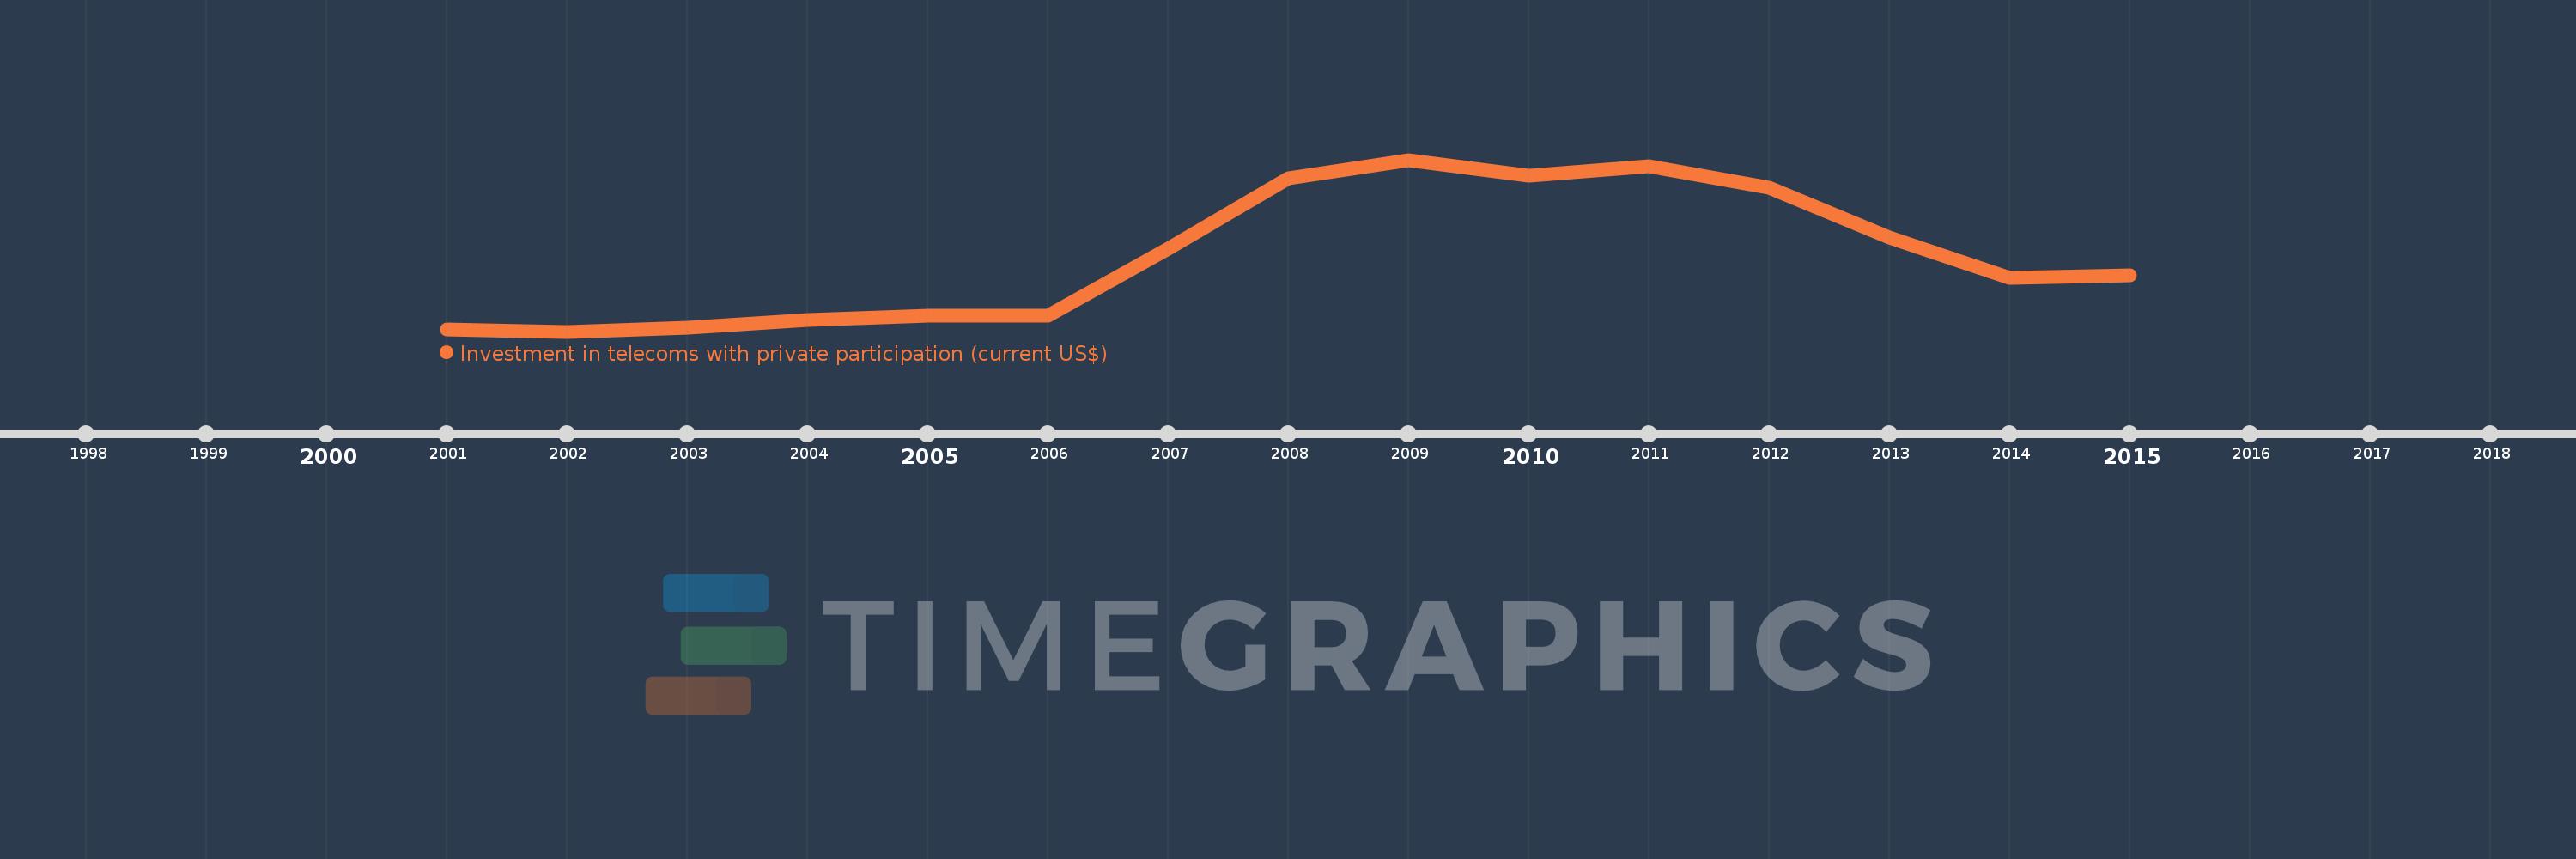
This timeline shows a graph from 2001 to 2015 of Heavily indebted poor countries (HIPC). No data until 2000. Number of actual observations by date: 15.
Source name:
World Development Indicators
Source organization:
World Bank, Private Participation in Infrastructure Project Database (http://ppi.worldbank.org).
Categories, topics:
Infrastructure, Private Sector
Last updated:
apr 23, 2017
Indicators value changes by year
Meaning:
3.013 bln
Minimum:
766.2 mln
jan 1, 2002
Maximum:
5.907 bln
jan 1, 2009
At the date of observation
Value
Absolute change
Change from the previous value
jan 1, 2001
839.7 mln
+839.7 mln
0.0%
jan 1, 2002
766.2 mln
-73.5 mln
-8.75%
jan 1, 2003
877.24 mln
+111.04 mln
14.49%
jan 1, 2004
1.123 bln
+246.105 mln
28.05%
jan 1, 2005
1.229 bln
+105.975 mln
9.43%
jan 1, 2006
1.248 bln
+18.73 mln
1.52%
jan 1, 2007
3.25 bln
+2.002 bln
160.42%
jan 1, 2008
5.362 bln
+2.112 bln
64.97%
jan 1, 2009
5.907 bln
+545.35 mln
10.17%
jan 1, 2010
5.423 bln
-483.95 mln
-8.19%
jan 1, 2011
5.708 bln
+285.1 mln
5.26%
jan 1, 2012
5.065 bln
-643.7 mln
-11.28%
jan 1, 2013
3.575 bln
-1.49 bln
-29.41%
jan 1, 2014
2.361 bln
-1.214 bln
-33.95%
jan 1, 2015
2.451 bln
+90.1 mln
3.82%
Ranking of countries by current statistics by years