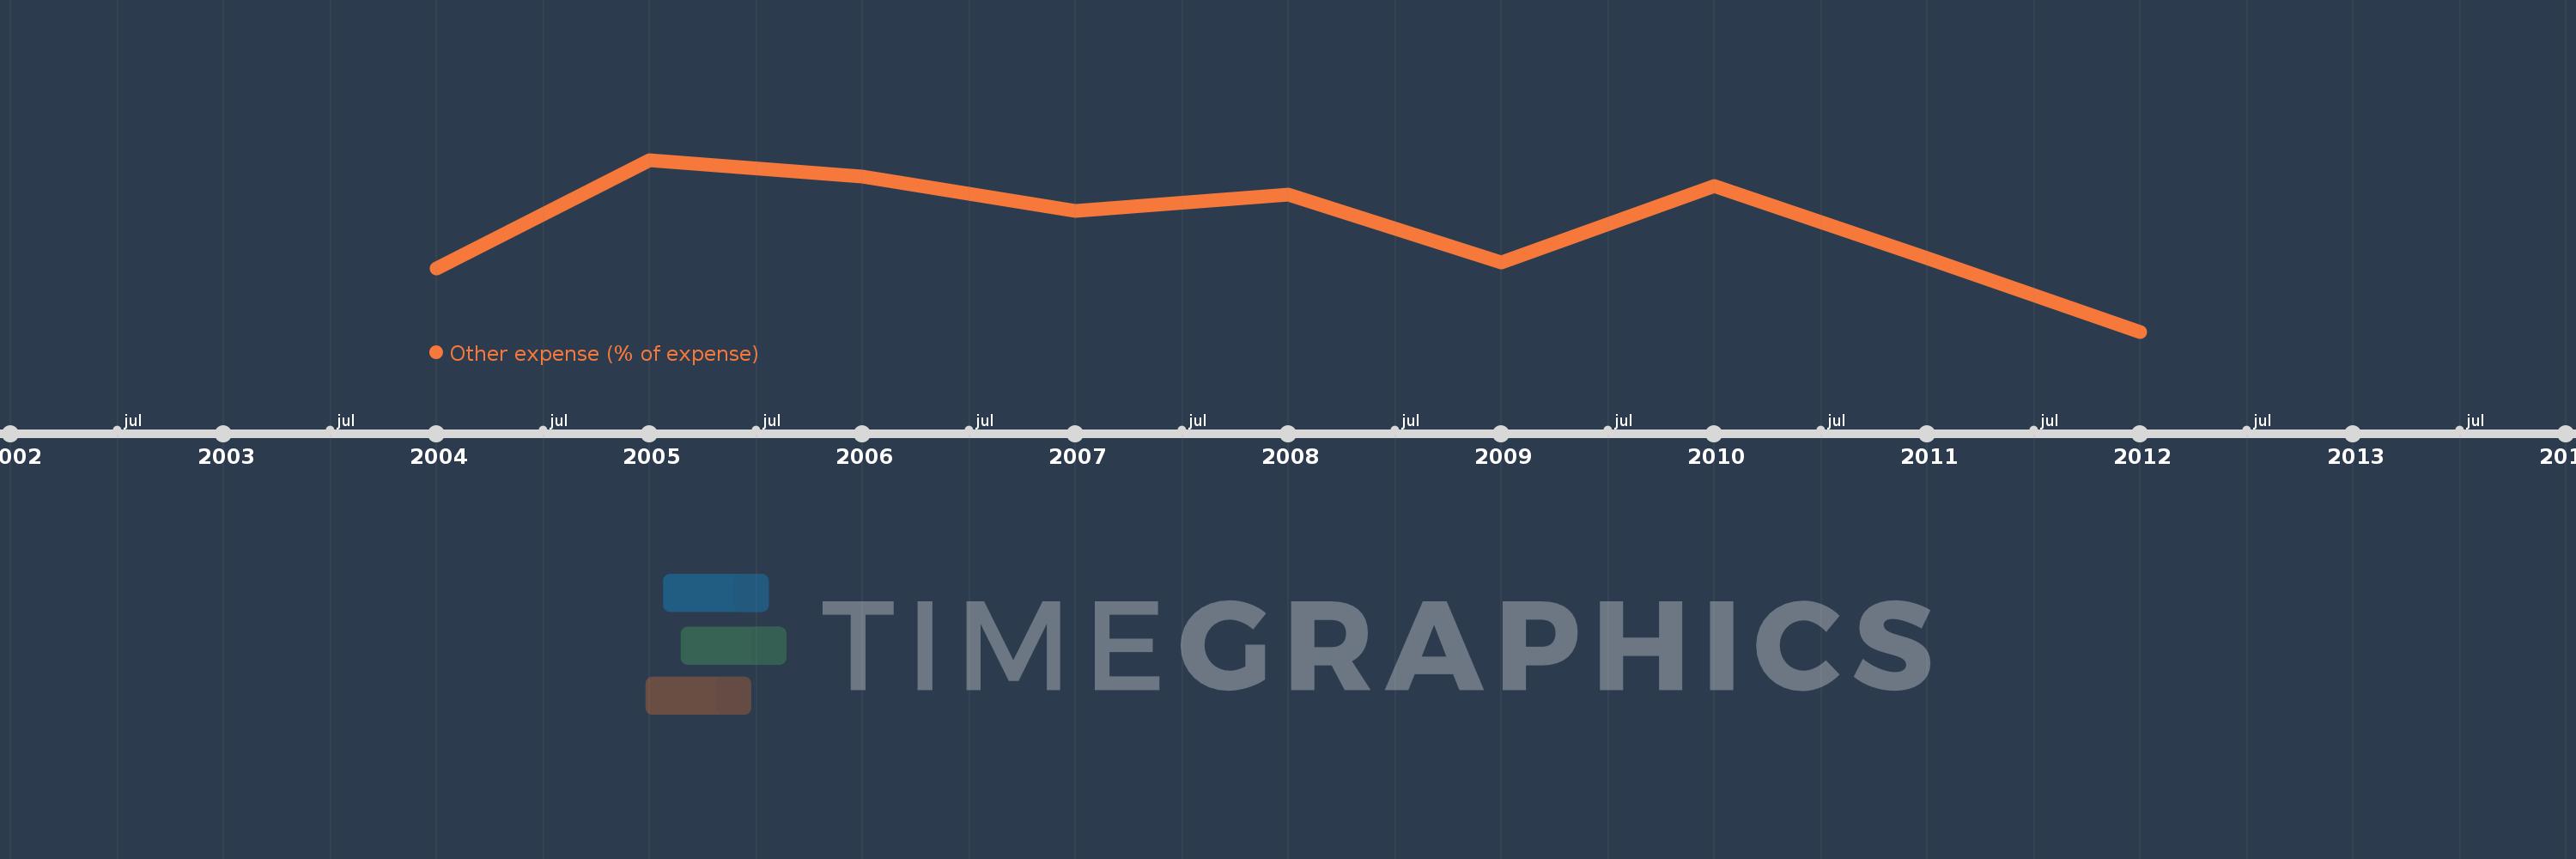
This timeline shows a graph from 2004 to 2012 of Middle East & North Africa (excluding high income). No data until 2003. Number of actual observations by date: 9.
Source name:
World Development Indicators
Source organization:
International Monetary Fund, Government Finance Statistics Yearbook and data files.
Categories, topics:
Public Sector
Last updated:
apr 23, 2017
Indicators value changes by year
Meaning:
8.858
Minimum:
4.774
jan 1, 2012
Maximum:
11.516
jan 1, 2005
At the date of observation
Value
Absolute change
Change from the previous value
jan 1, 2004
7.267
+7.267
0.0%
jan 1, 2005
11.516
+4.249
58.47%
jan 1, 2006
10.864
-0.653
-5.67%
jan 1, 2007
9.526
-1.338
-12.32%
jan 1, 2008
10.158
+0.633
6.64%
jan 1, 2009
7.489
-2.67
-26.28%
jan 1, 2010
10.474
+2.986
39.87%
jan 1, 2011
7.652
-2.822
-26.94%
jan 1, 2012
4.774
-2.879
-37.62%
Ranking of countries by current statistics by years