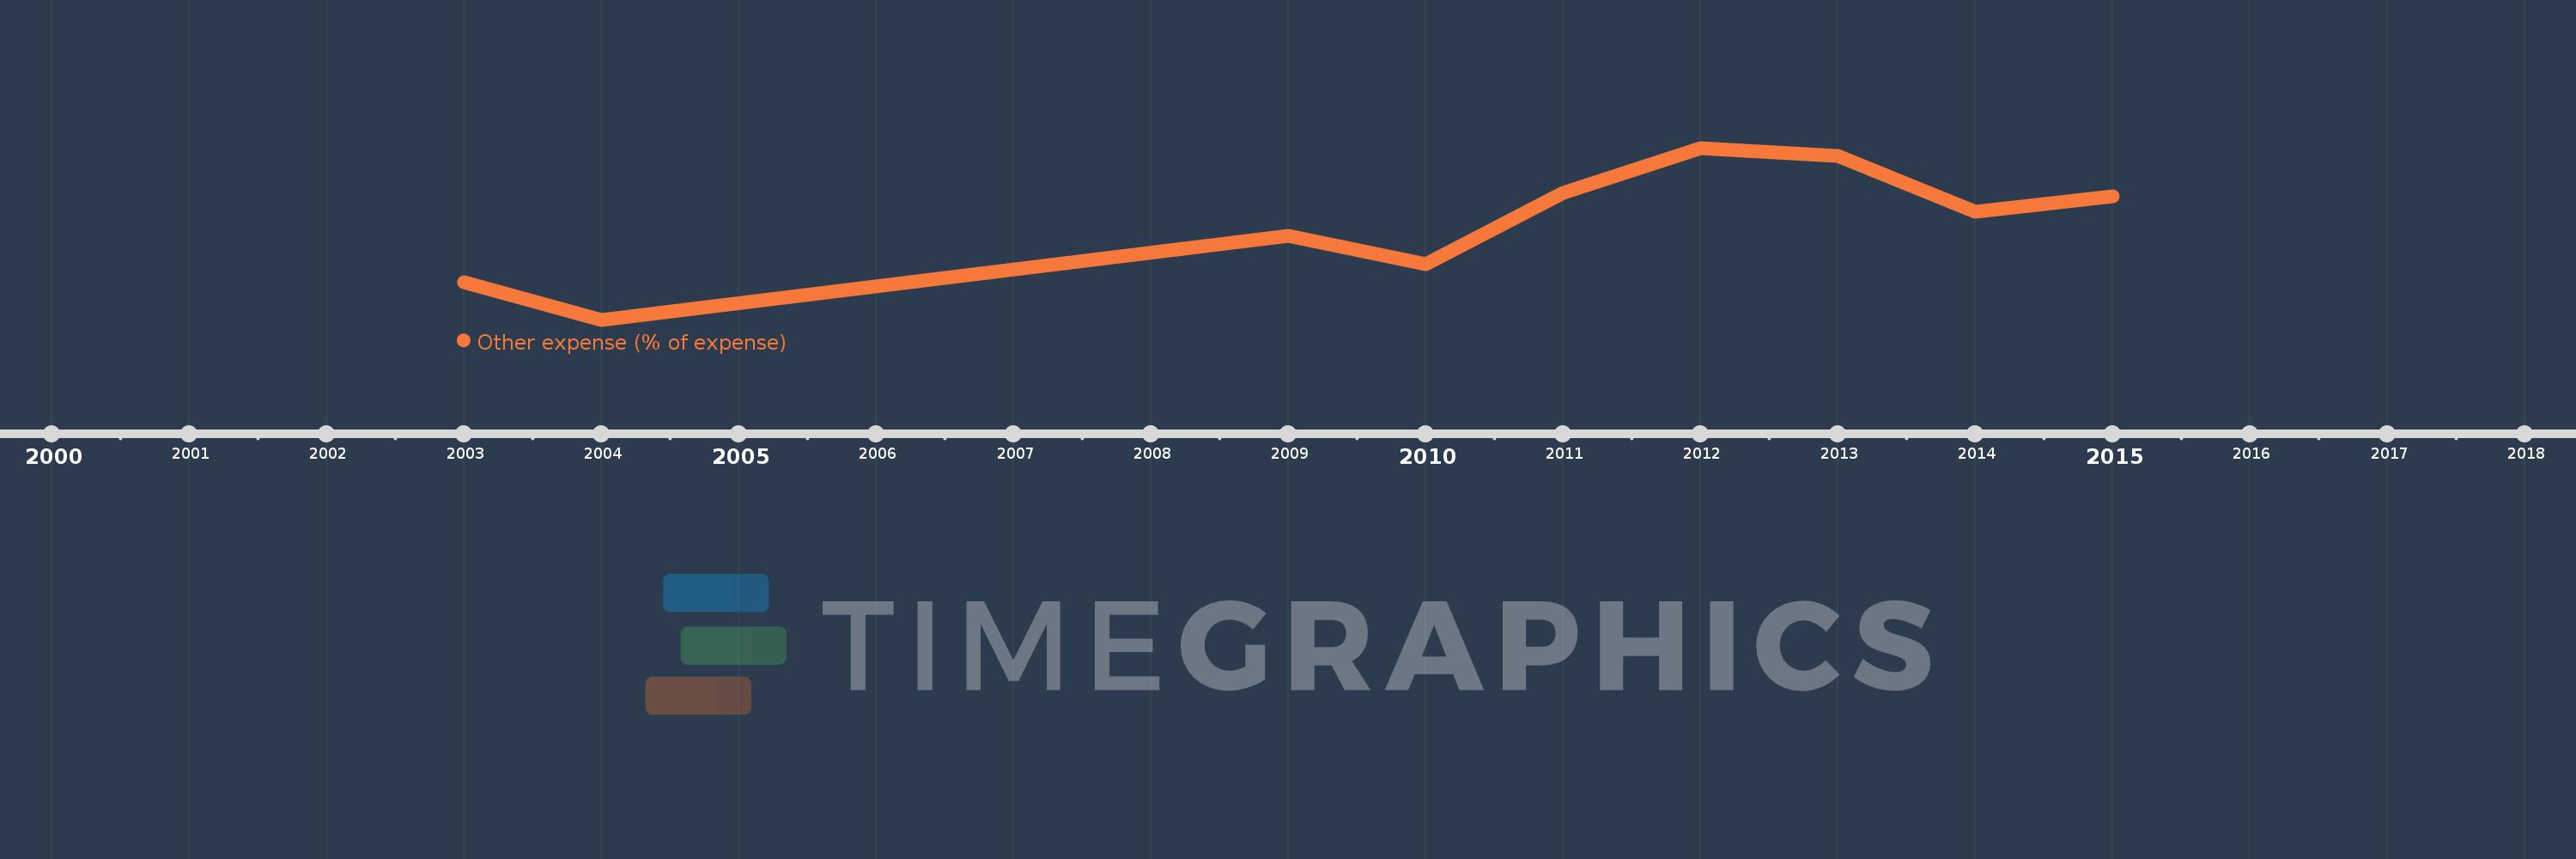
This timeline shows a graph from 2003 to 2015 of East Asia & Pacific (IDA & IBRD countries). No data until 2002. Number of actual observations by date: 9.
Source name:
World Development Indicators
Source organization:
International Monetary Fund, Government Finance Statistics Yearbook and data files.
Categories, topics:
Public Sector
Last updated:
apr 23, 2017
Indicators value changes by year
Meaning:
4.026
Minimum:
1.05
jan 1, 2004
Maximum:
6.333
jan 1, 2012
At the date of observation
Value
Absolute change
Change from the previous value
jan 1, 2003
2.2
+2.2
0.0%
jan 1, 2004
1.05
-1.15
-52.29%
jan 1, 2009
3.639
+2.589
246.68%
jan 1, 2010
2.749
-0.89
-24.46%
jan 1, 2011
4.962
+2.213
80.51%
jan 1, 2012
6.333
+1.372
27.64%
jan 1, 2013
6.089
-0.245
-3.86%
jan 1, 2014
4.361
-1.728
-28.38%
jan 1, 2015
4.853
+0.492
11.28%
Ranking of countries by current statistics by years