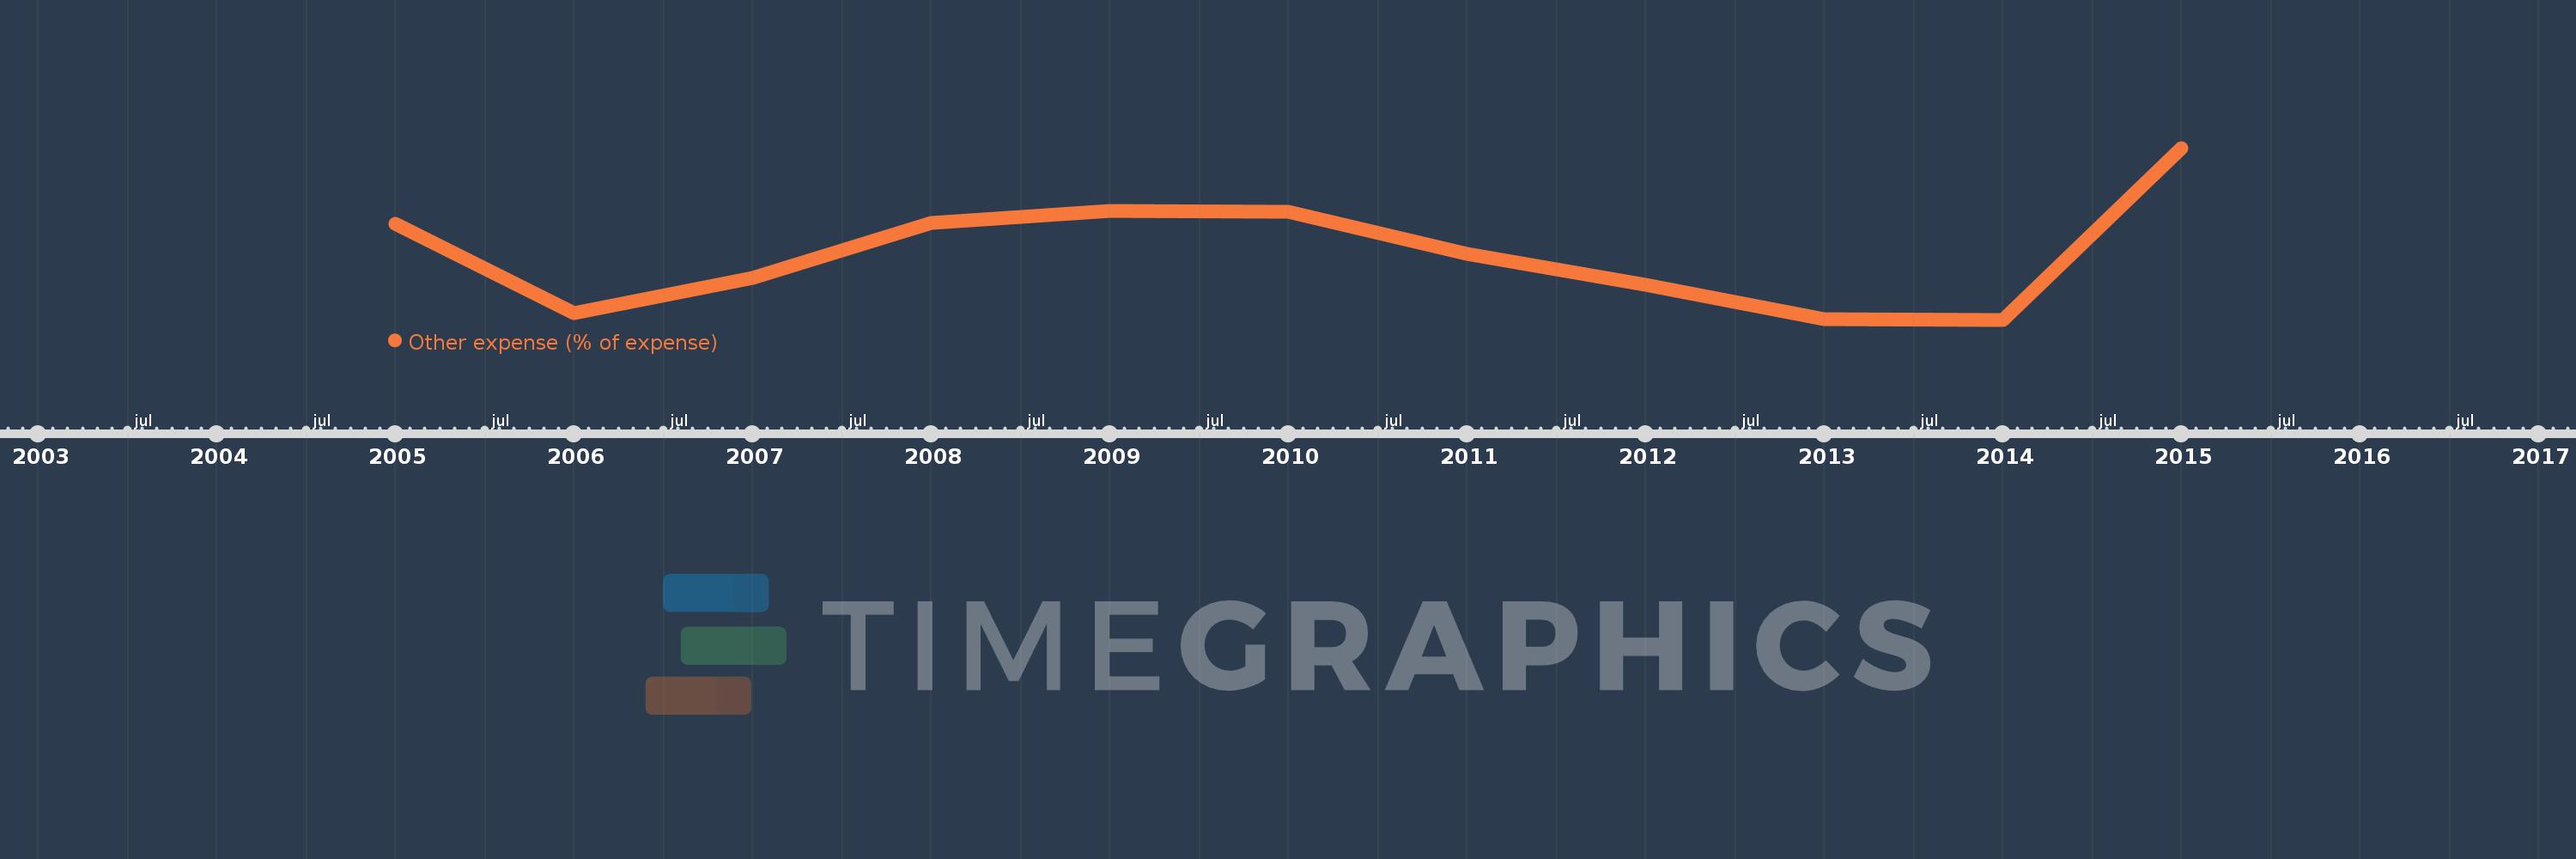
This timeline shows a graph from 2005 to 2015 of Europe & Central Asia (excluding high income). No data until 2004. Number of actual observations by date: 11.
Source name:
World Development Indicators
Source organization:
International Monetary Fund, Government Finance Statistics Yearbook and data files.
Categories, topics:
Public Sector
Last updated:
apr 23, 2017
Indicators value changes by year
Meaning:
5.118
Minimum:
4.124
jan 1, 2014
Maximum:
6.694
jan 1, 2015
At the date of observation
Value
Absolute change
Change from the previous value
jan 1, 2005
5.562
+5.562
0.0%
jan 1, 2006
4.221
-1.34
-24.1%
jan 1, 2007
4.746
+0.524
12.42%
jan 1, 2008
5.572
+0.826
17.41%
jan 1, 2009
5.755
+0.183
3.28%
jan 1, 2010
5.743
-0.011
-0.2%
jan 1, 2011
5.105
-0.638
-11.12%
jan 1, 2012
4.649
-0.456
-8.94%
jan 1, 2013
4.128
-0.521
-11.21%
jan 1, 2014
4.124
-0.004
-0.09%
jan 1, 2015
6.694
+2.571
62.33%
Ranking of countries by current statistics by years