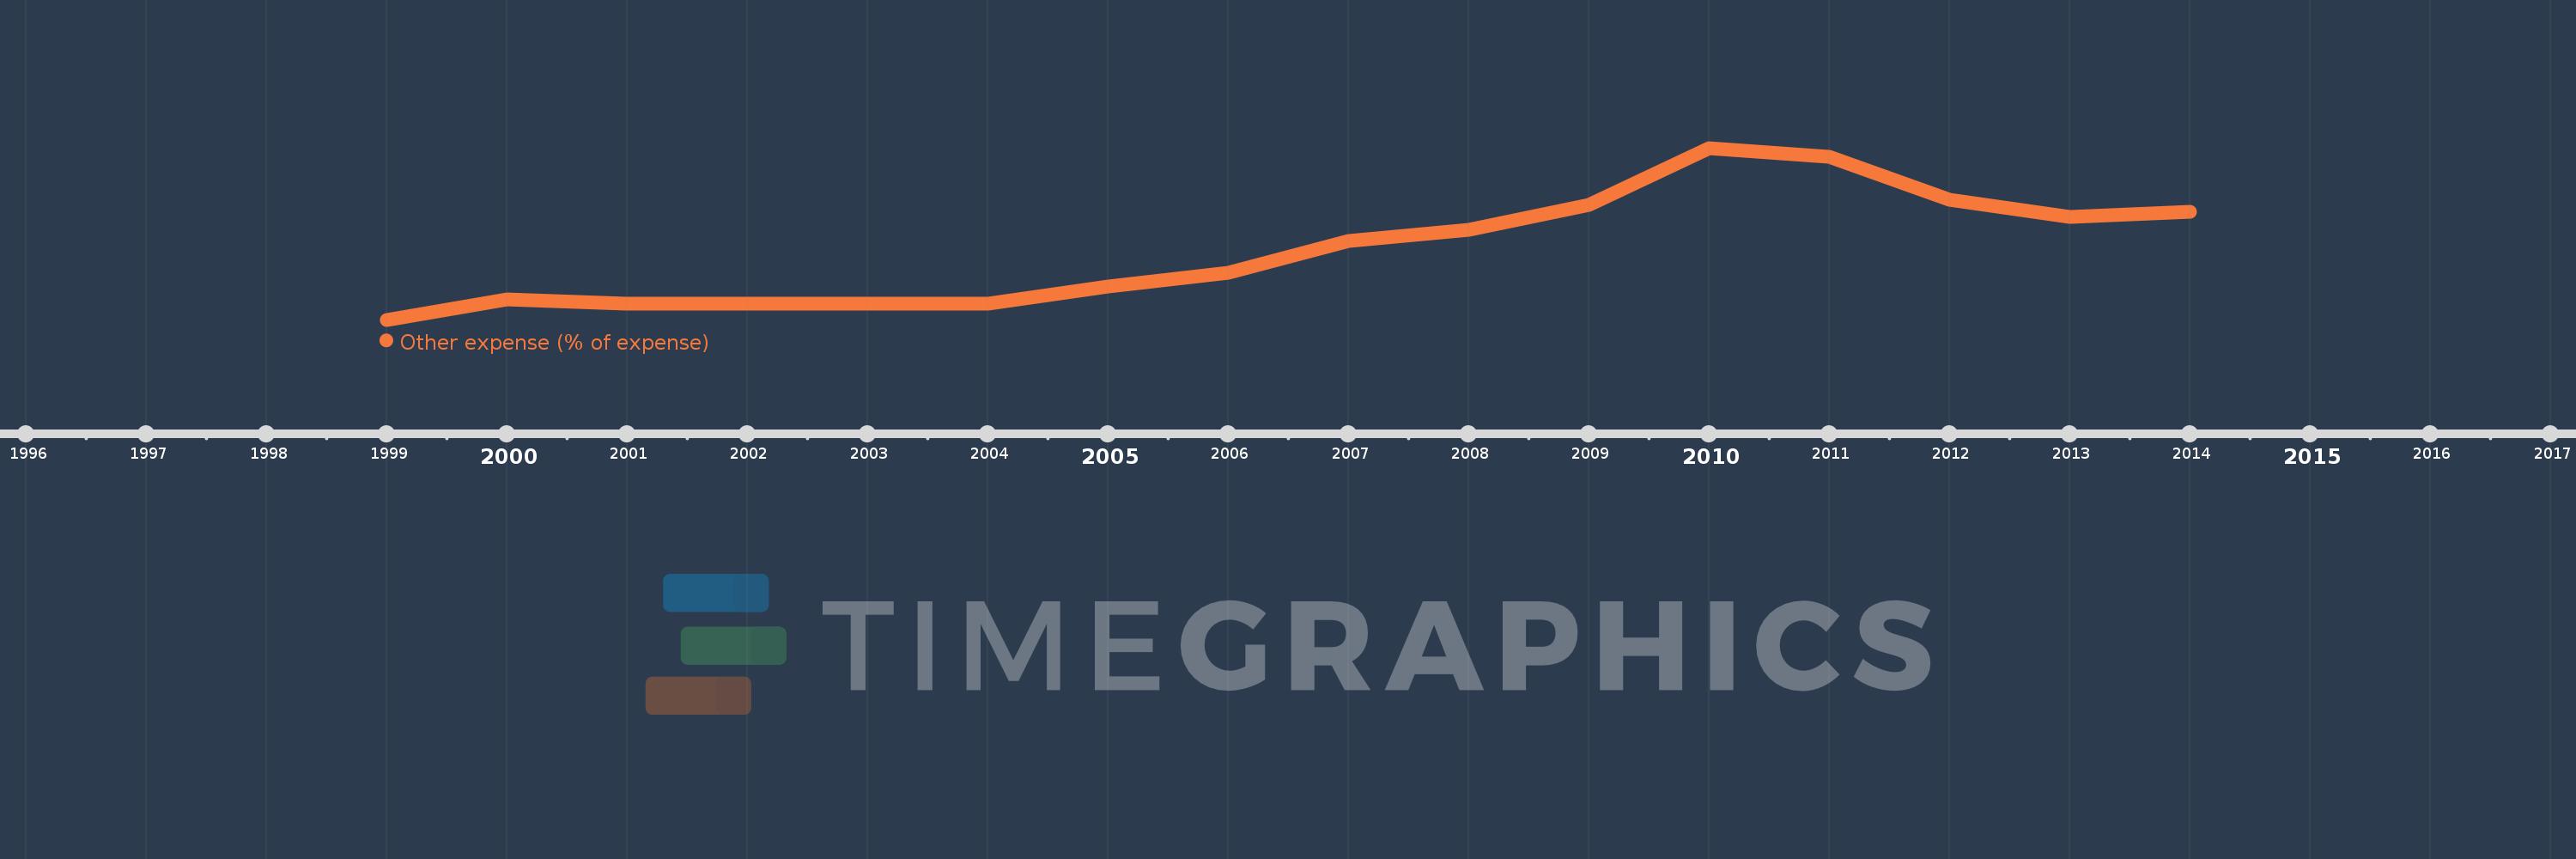
This timeline shows a graph from 1999 to 2014 of Latin America & Caribbean (excluding high income). No data until 1998. Number of actual observations by date: 14.
Source name:
World Development Indicators
Source organization:
International Monetary Fund, Government Finance Statistics Yearbook and data files.
Categories, topics:
Public Sector
Last updated:
apr 23, 2017
Indicators value changes by year
Meaning:
6.952
Minimum:
2.688
jan 1, 1999
Maximum:
12.154
jan 1, 2010
At the date of observation
Value
Absolute change
Change from the previous value
jan 1, 1999
2.688
+2.688
0.0%
jan 1, 2000
3.829
+1.142
42.47%
jan 1, 2001
3.582
-0.247
-6.46%
jan 1, 2004
3.582
+0.0
0.01%
jan 1, 2005
4.535
+0.953
26.59%
jan 1, 2006
5.286
+0.751
16.56%
jan 1, 2007
7.027
+1.741
32.94%
jan 1, 2008
7.646
+0.619
8.81%
jan 1, 2009
9.011
+1.365
17.85%
jan 1, 2010
12.154
+3.143
34.88%
jan 1, 2011
11.683
-0.471
-3.87%
jan 1, 2012
9.28
-2.403
-20.57%
jan 1, 2013
8.368
-0.911
-9.82%
jan 1, 2014
8.65
+0.282
3.37%
Ranking of countries by current statistics by years