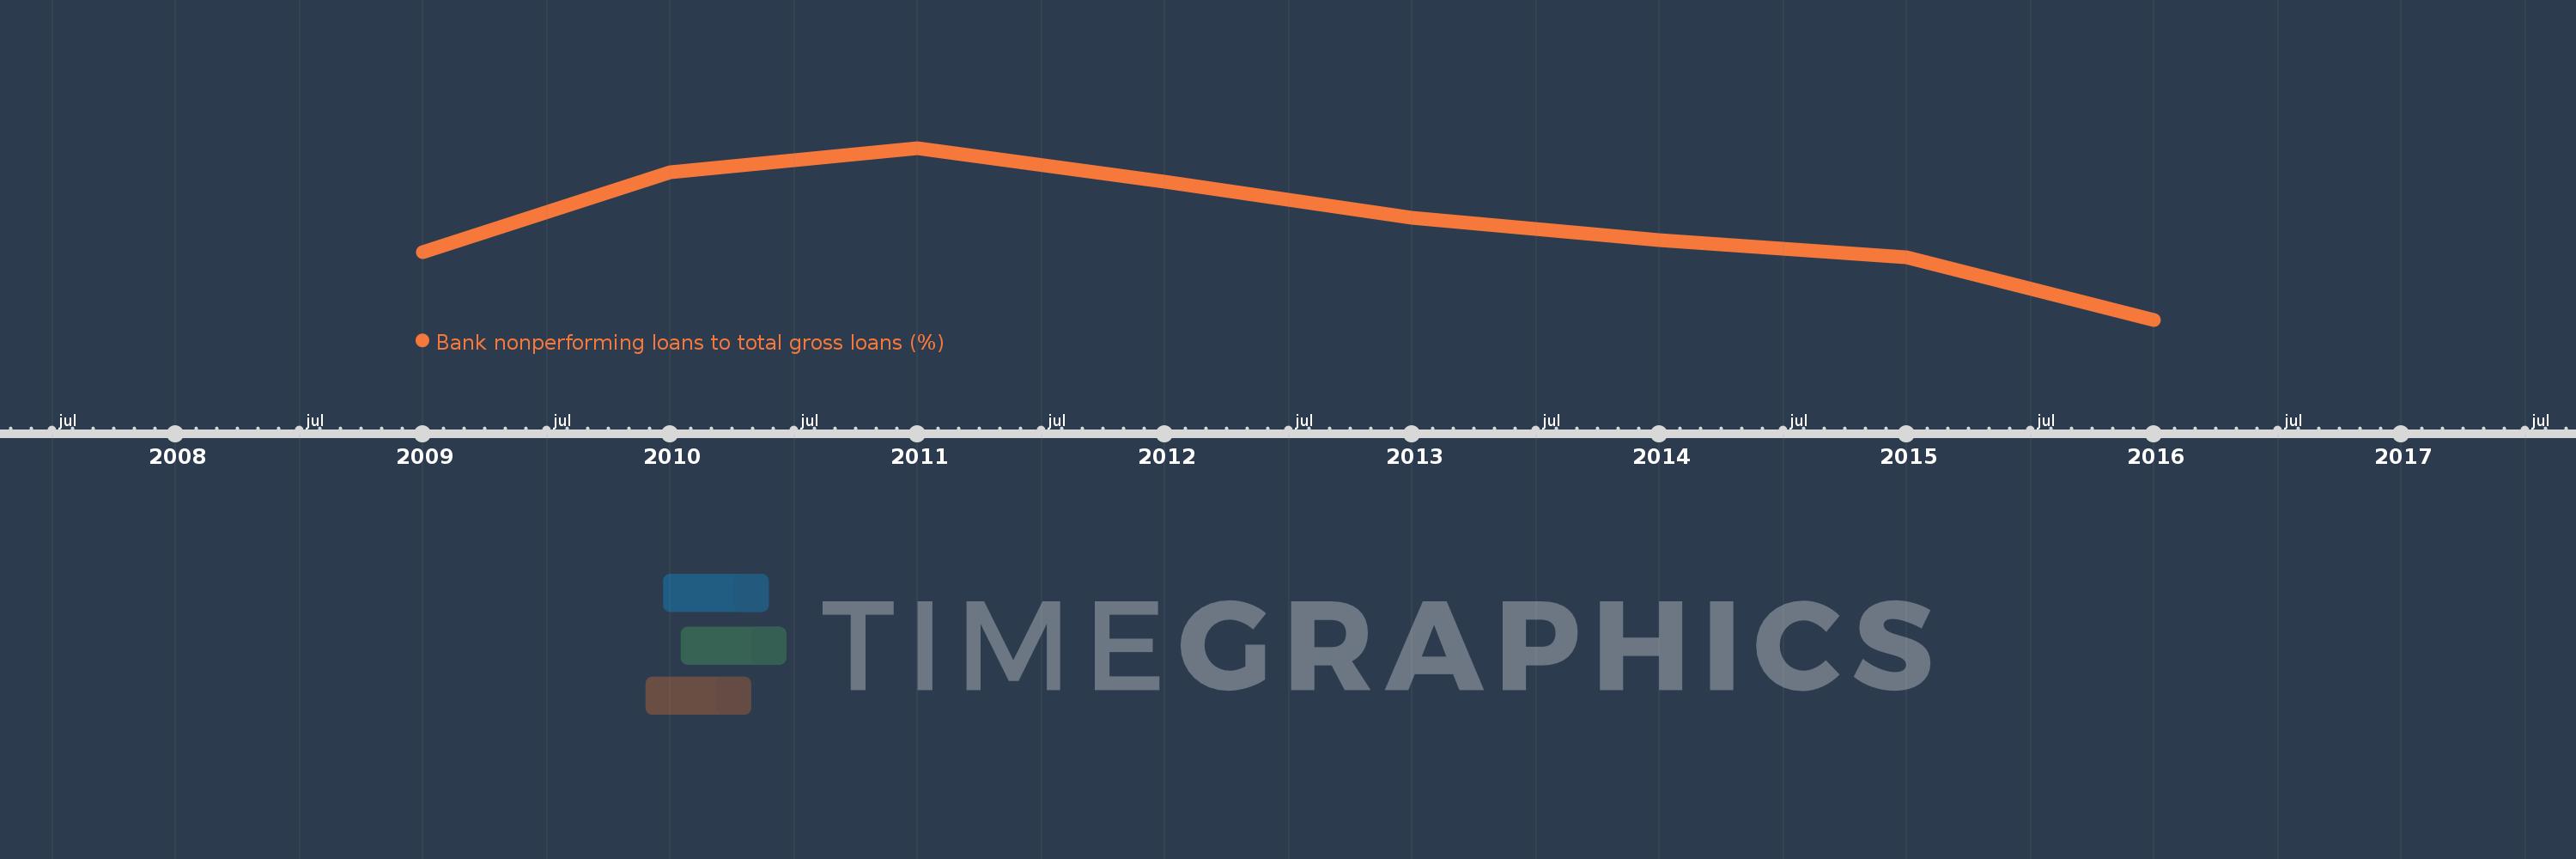
This timeline shows a graph from 2009 to 2016 of Middle East & North Africa (excluding high income). No data until 2008. Number of actual observations by date: 8.
Source name:
World Development Indicators
Source organization:
International Monetary Fund, Global Financial Stability Report.
Categories, topics:
Financial Sector
Last updated:
apr 23, 2017
Indicators value changes by year
Meaning:
8.591
Minimum:
6.05
jan 1, 2016
Maximum:
10.6
jan 1, 2011
At the date of observation
Value
Absolute change
Change from the previous value
jan 1, 2009
7.832
+7.832
0.0%
jan 1, 2010
9.95
+2.118
27.04%
jan 1, 2011
10.6
+0.65
6.53%
jan 1, 2012
9.7
-0.9
-8.49%
jan 1, 2013
8.75
-0.95
-9.79%
jan 1, 2014
8.15
-0.6
-6.86%
jan 1, 2015
7.7
-0.45
-5.52%
jan 1, 2016
6.05
-1.65
-21.43%
Ranking of countries by current statistics by years