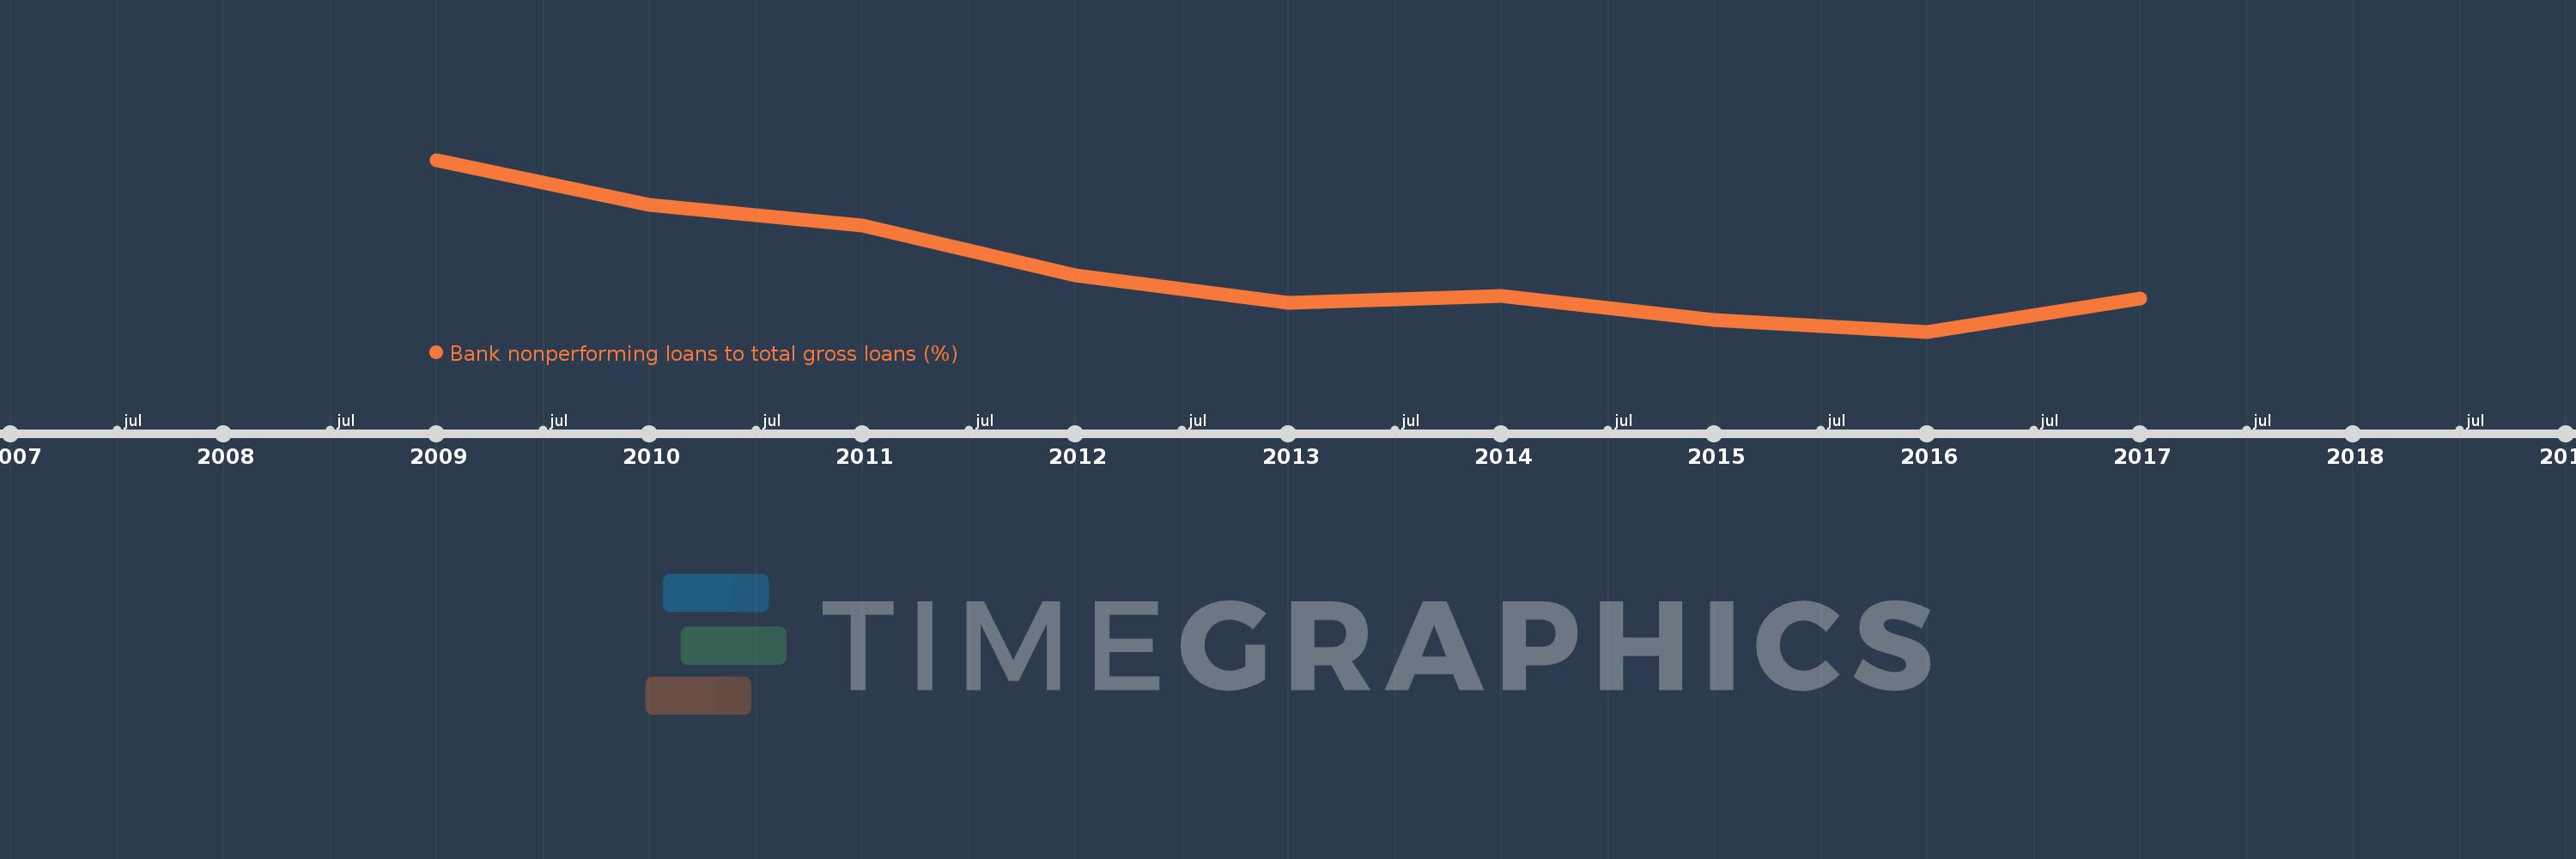
This timeline shows a graph from 2009 to 2017 of East Asia & Pacific (IDA & IBRD countries). No data until 2008. Number of actual observations by date: 9.
Source name:
World Development Indicators
Source organization:
International Monetary Fund, Global Financial Stability Report.
Categories, topics:
Financial Sector
Last updated:
apr 23, 2017
Indicators value changes by year
Meaning:
2.635
Minimum:
1.885
jan 1, 2016
Maximum:
3.92
jan 1, 2009
At the date of observation
Value
Absolute change
Change from the previous value
jan 1, 2009
3.92
+3.92
0.0%
jan 1, 2010
3.389
-0.531
-13.54%
jan 1, 2011
3.142
-0.247
-7.29%
jan 1, 2012
2.555
-0.586
-18.66%
jan 1, 2013
2.223
-0.333
-13.01%
jan 1, 2014
2.303
+0.08
3.59%
jan 1, 2015
2.025
-0.278
-12.07%
jan 1, 2016
1.885
-0.139
-6.88%
jan 1, 2017
2.275
+0.389
20.63%
Ranking of countries by current statistics by years