Download This statistics in other country:
Timeline:
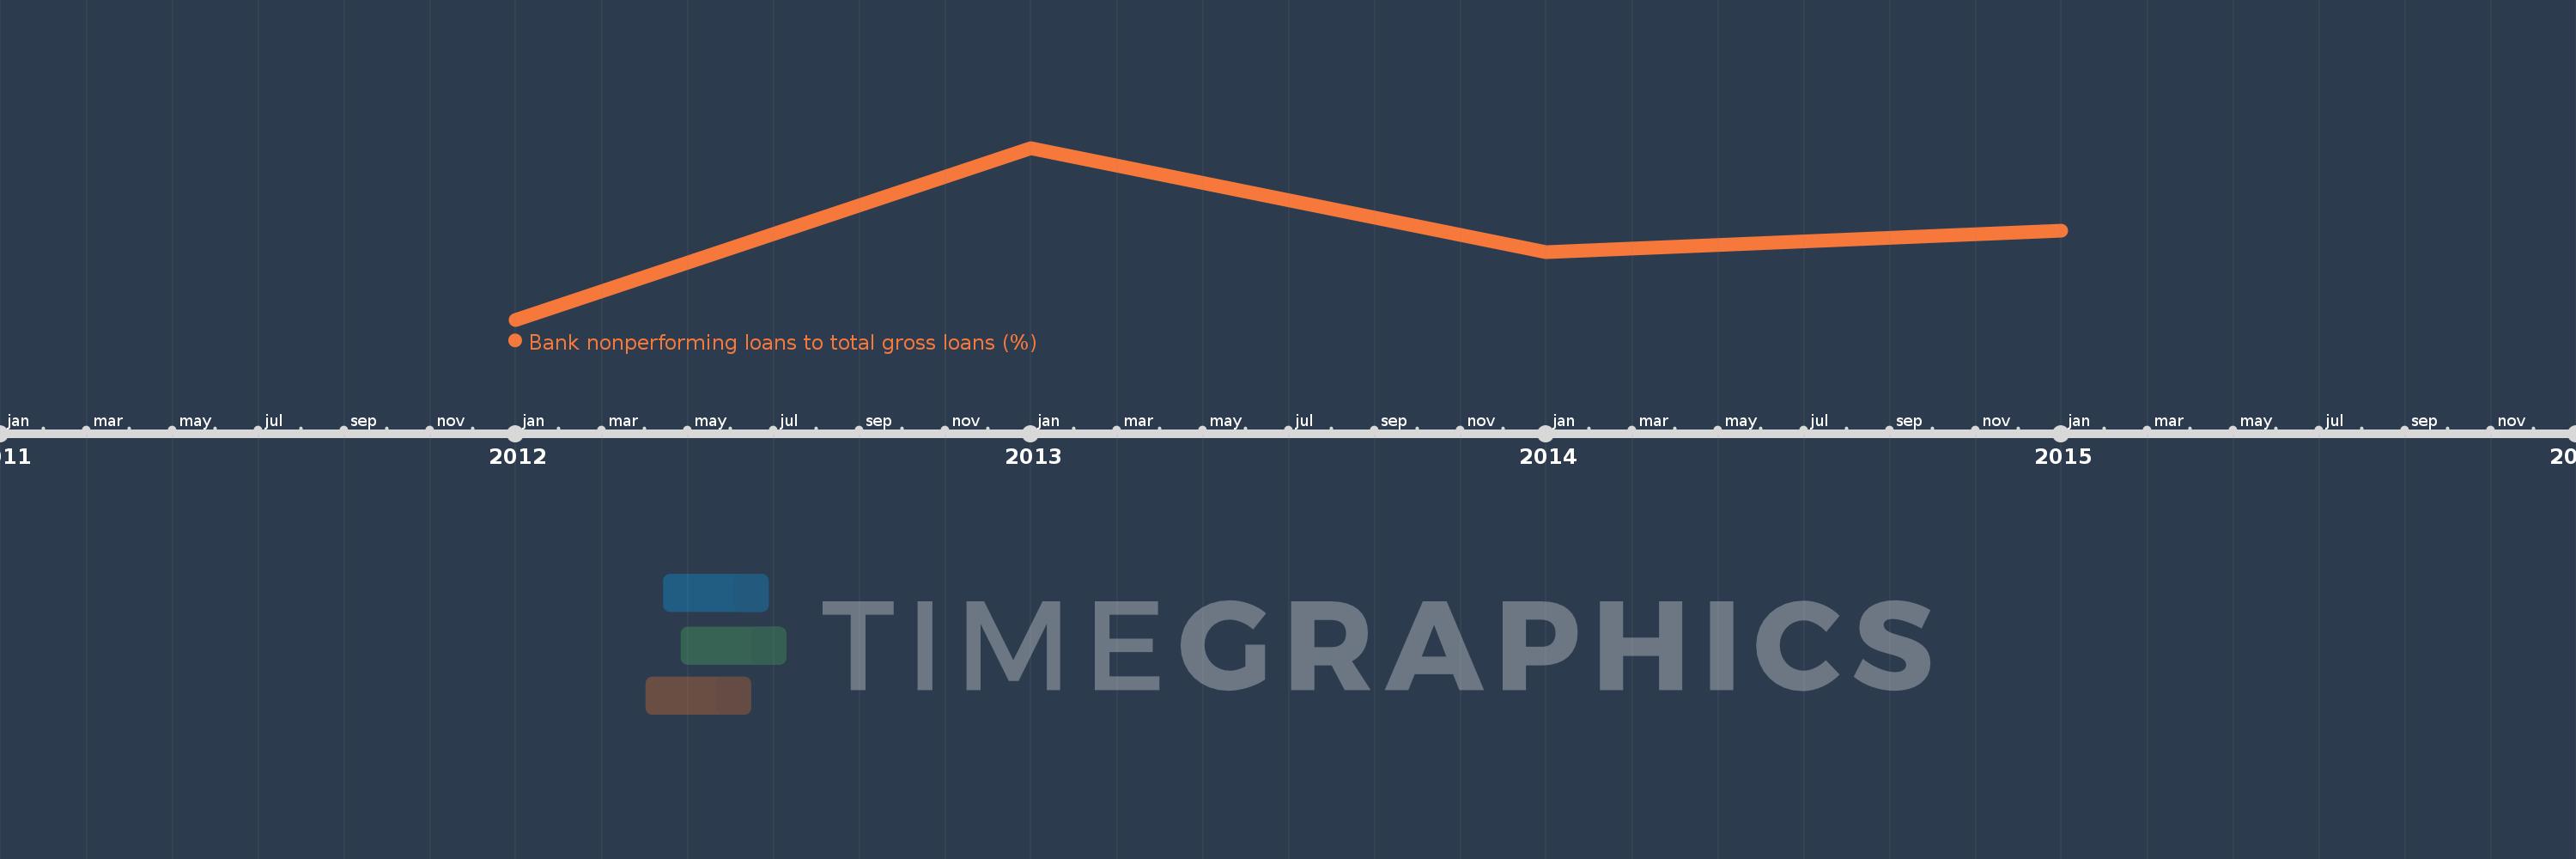
This timeline shows a graph from 2012 to 2015 of IDA total. No data until 2011. Number of actual observations by date: 4.
Source name:
World Development Indicators
Source organization:
International Monetary Fund, Global Financial Stability Report.
Categories, topics:
Financial Sector
Last updated:
apr 23, 2017
Indicators value changes by year
At the date of observation
Value
Absolute change
Change from the previous value
jan 1, 2012
5.81
+5.81
0.0%
jan 1, 2013
6.801
+0.991
17.05%
jan 1, 2014
6.202
-0.599
-8.8%
jan 1, 2015
6.324
+0.122
1.97%
Ranking of countries by current statistics by years