Download This statistics in other country:
Timeline:
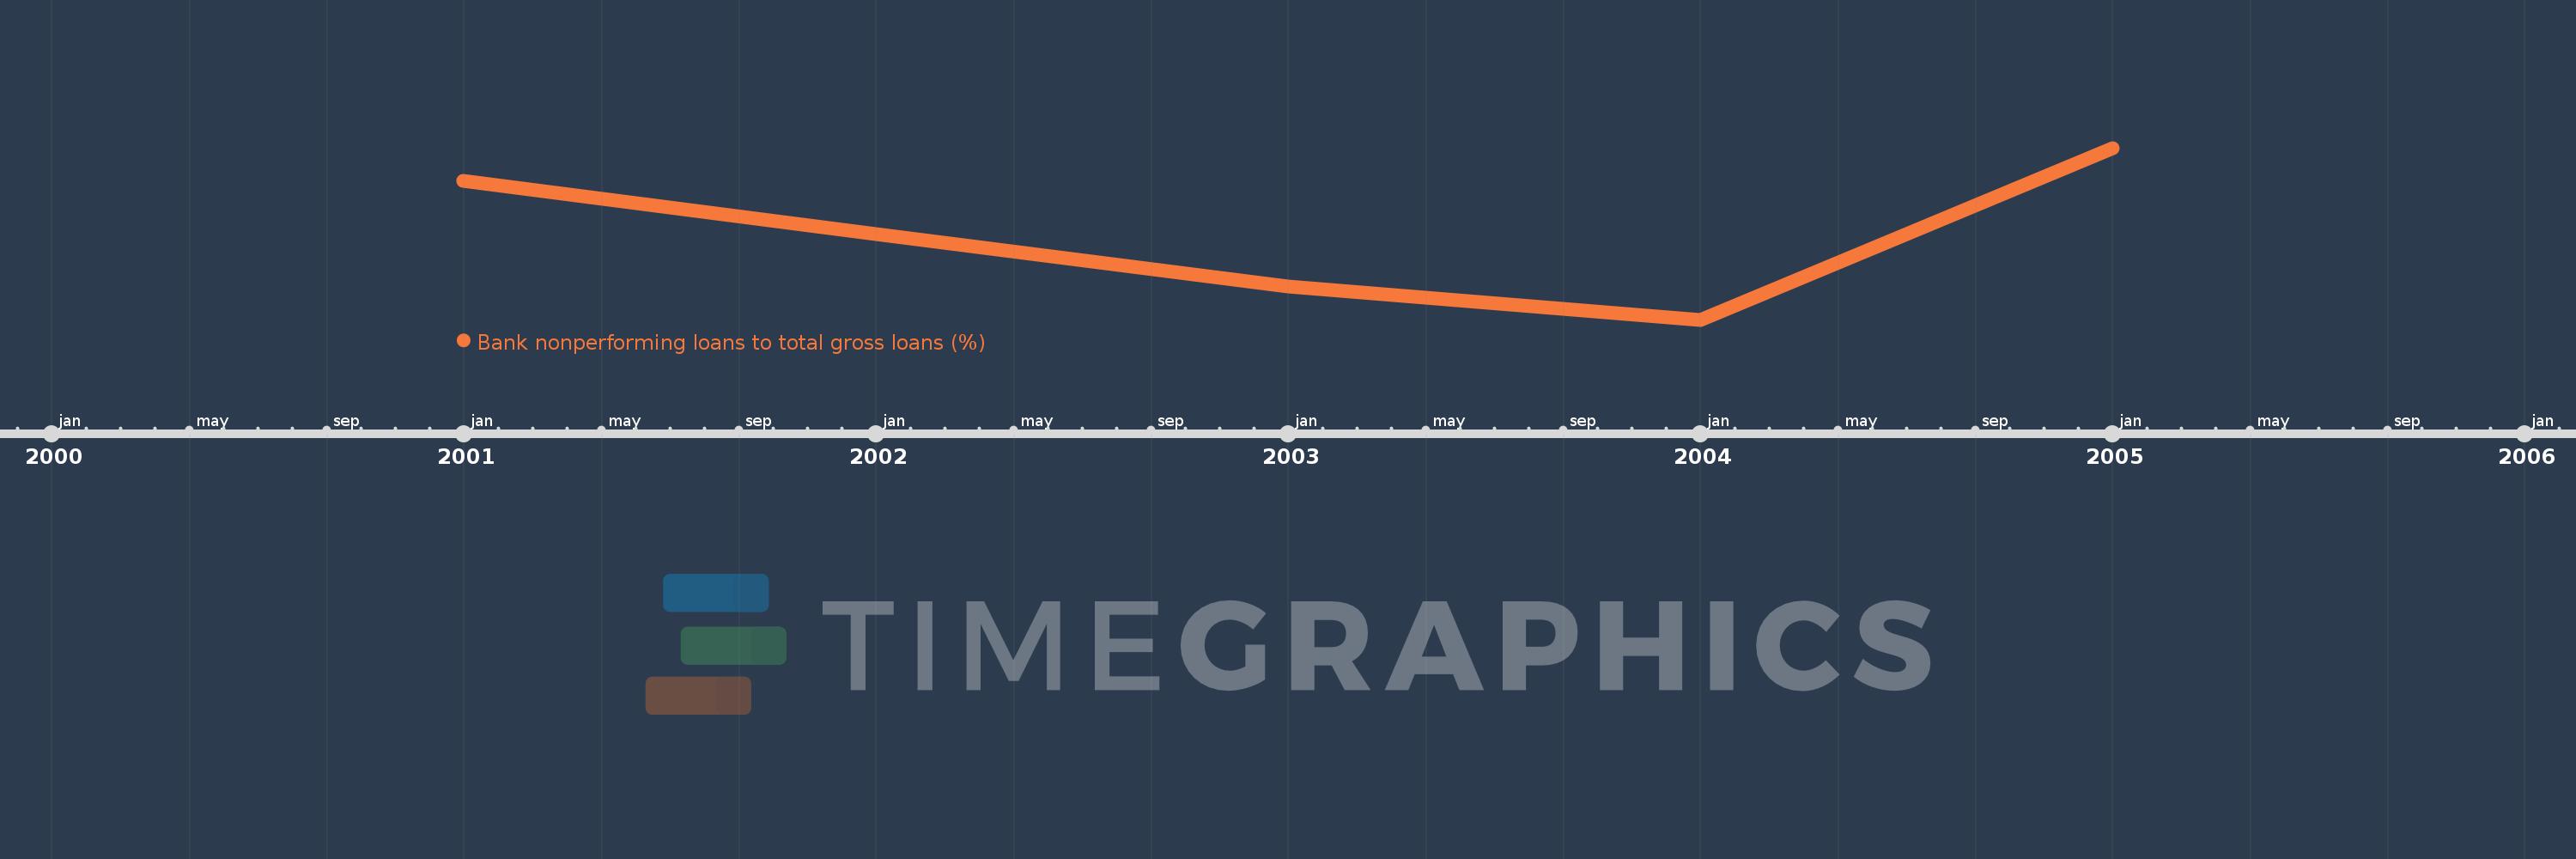
This timeline shows a graph from 2001 to 2005 of Zimbabwe. No data until 2000. Number of actual observations by date: 5.
Source name:
World Development Indicators
Source organization:
International Monetary Fund, Global Financial Stability Report.
Categories, topics:
Financial Sector
Last updated:
apr 23, 2017
Indicators value changes by year
At the date of observation
Value
Absolute change
Change from the previous value
jan 1, 2001
19.6
+19.6
0.0%
jan 1, 2002
13.7
-5.9
-30.1%
jan 1, 2003
7.9
-5.8
-42.34%
jan 1, 2004
4.2
-3.7
-46.84%
jan 1, 2005
23.2
+19.0
452.38%
Ranking of countries by current statistics by years