33
/
AIzaSyB4mHJ5NPEv-XzF7P6NDYXjlkCWaeKw5bc
November 30, 2025
48088
Middle East & North Africa
MEA
false
2
1
Fertilizer consumption (% of fertilizer production)
2015,2014,2013,2012,2011,2010,2009,2008,2007,2006,2005,2004,2003
Create a timeline
Public Timelines
For education
For educational institutions
For teachers
For students
Cabinet
For educational institutions
For teachers
For students
Open cabinet
FAQ
Close
Create a timeline
Public timelines
FAQ
About & Feedback
Terms
Privacy
FAQ
Support 24/7
Cabinet
Get premium
Donate
Download
Global statistics library
→
Middle East & North Africa
→
Fertilizer consumption (% of fertilizer production)
This statistics in other country:
Afghanistan
Algeria
Arab World
Argentina
Armenia
Australia
Bahrain
Bangladesh
Belarus
Belgium
Bosnia and Herzegovina
Brazil
Bulgaria
Canada
Caribbean small states
Central Europe and the Baltics
Chile
China
Colombia
Croatia
Cuba
Czech Republic
Denmark
Early-demographic dividend
East Asia & Pacific
East Asia & Pacific (excluding high income)
East Asia & Pacific (IDA & IBRD countries)
Egypt, Arab Rep.
Estonia
Euro area
Europe & Central Asia
Europe & Central Asia (excluding high income)
Europe & Central Asia (IDA & IBRD countries)
European Union
Finland
Fragile and conflict affected situations
France
Georgia
Germany
Greece
Heavily indebted poor countries (HIPC)
High income
Hungary
IBRD only
IDA & IBRD total
IDA blend
IDA only
IDA total
India
Indonesia
Iran, Islamic Rep.
Iraq
Ireland
Israel
Italy
Japan
Jordan
Kazakhstan
Korea, Rep.
Kuwait
Late-demographic dividend
Latin America & Caribbean
Latin America & Caribbean (excluding high income)
Latin America & the Caribbean (IDA & IBRD countries)
Least developed countries: UN classification
Lebanon
Libya
Lithuania
Low & middle income
Low income
Lower middle income
Malawi
Malaysia
Mali
Mauritius
Mexico
Middle East & North Africa
Middle East & North Africa (excluding high income)
Middle East & North Africa (IDA & IBRD countries)
Middle income
Morocco
Myanmar
Netherlands
New Zealand
Nigeria
North America
Norway
OECD members
Oman
Other small states
Pakistan
Peru
Philippines
Poland
Portugal
Post-demographic dividend
Pre-demographic dividend
Qatar
Romania
Russian Federation
Saudi Arabia
Senegal
Serbia
Slovak Republic
Slovenia
Small states
South Africa
South Asia
South Asia (IDA & IBRD)
Spain
Sri Lanka
Sub-Saharan Africa
Sub-Saharan Africa (excluding high income)
Sub-Saharan Africa (IDA & IBRD countries)
Sweden
Syrian Arab Republic
Tajikistan
Thailand
Trinidad and Tobago
Tunisia
Turkey
Ukraine
United Arab Emirates
United Kingdom
United States
Upper middle income
Uruguay
Uzbekistan
Venezuela, RB
Vietnam
World
Zimbabwe
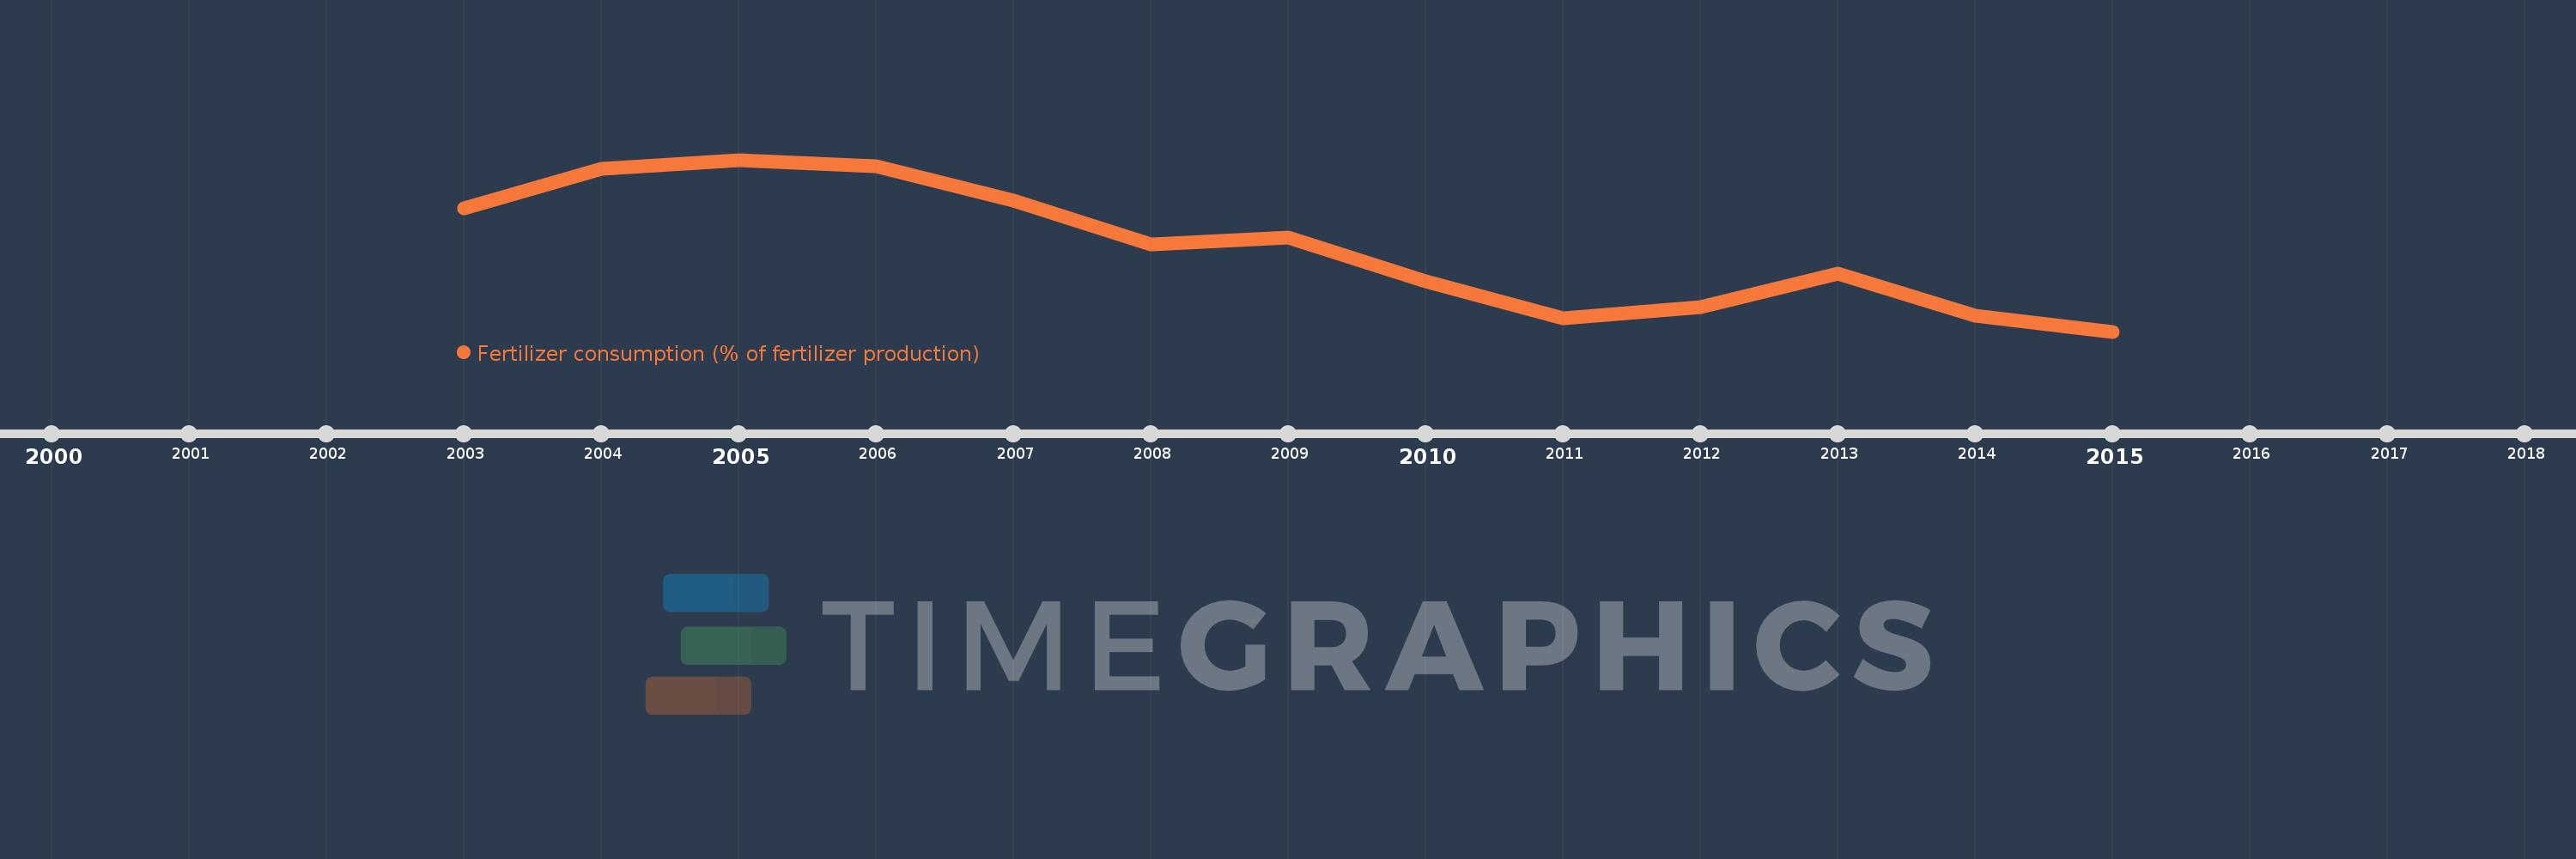
Timeline:
This timeline shows a graph from
2003
to
2015
of Middle East & North Africa. No data until
2002
. Number of actual observations by date:
13
.
Source name:
World Development Indicators
Source organization:
Food and Agriculture Organization, electronic files and web site.
Categories, topics:
Agriculture & Rural Development
Last updated:
apr 23, 2017
Indicators value changes by year
Meaning:
30.225
Minimum:
22.733
jan 1, 2015
Maximum:
37.986
jan 1, 2005
At the date of observation
Value
Absolute change
Change from the previous value
jan 1, 2003
33.662
+33.662
0.0%
jan 1, 2004
37.181
+3.519
10.45%
jan 1, 2005
37.986
+0.805
2.17%
jan 1, 2006
37.436
-0.55
-1.45%
jan 1, 2007
34.346
-3.09
-8.25%
jan 1, 2008
30.5
-3.846
-11.2%
jan 1, 2009
31.073
+0.573
1.88%
jan 1, 2010
27.194
-3.879
-12.48%
jan 1, 2011
23.939
-3.255
-11.97%
jan 1, 2012
24.884
+0.944
3.95%
jan 1, 2013
27.856
+2.973
11.95%
jan 1, 2014
24.136
-3.72
-13.35%
jan 1, 2015
22.733
-1.403
-5.81%
Ranking of countries by current statistics by years
About & Feedback
Terms
Privacy
FAQ
Support 24/7
Cabinet
Get premium
Donate
The service accepts bank transfer (ACH, Wire) or cards (Visa, MasterCard, etc). Processed by Stripe.
Secured with SSL