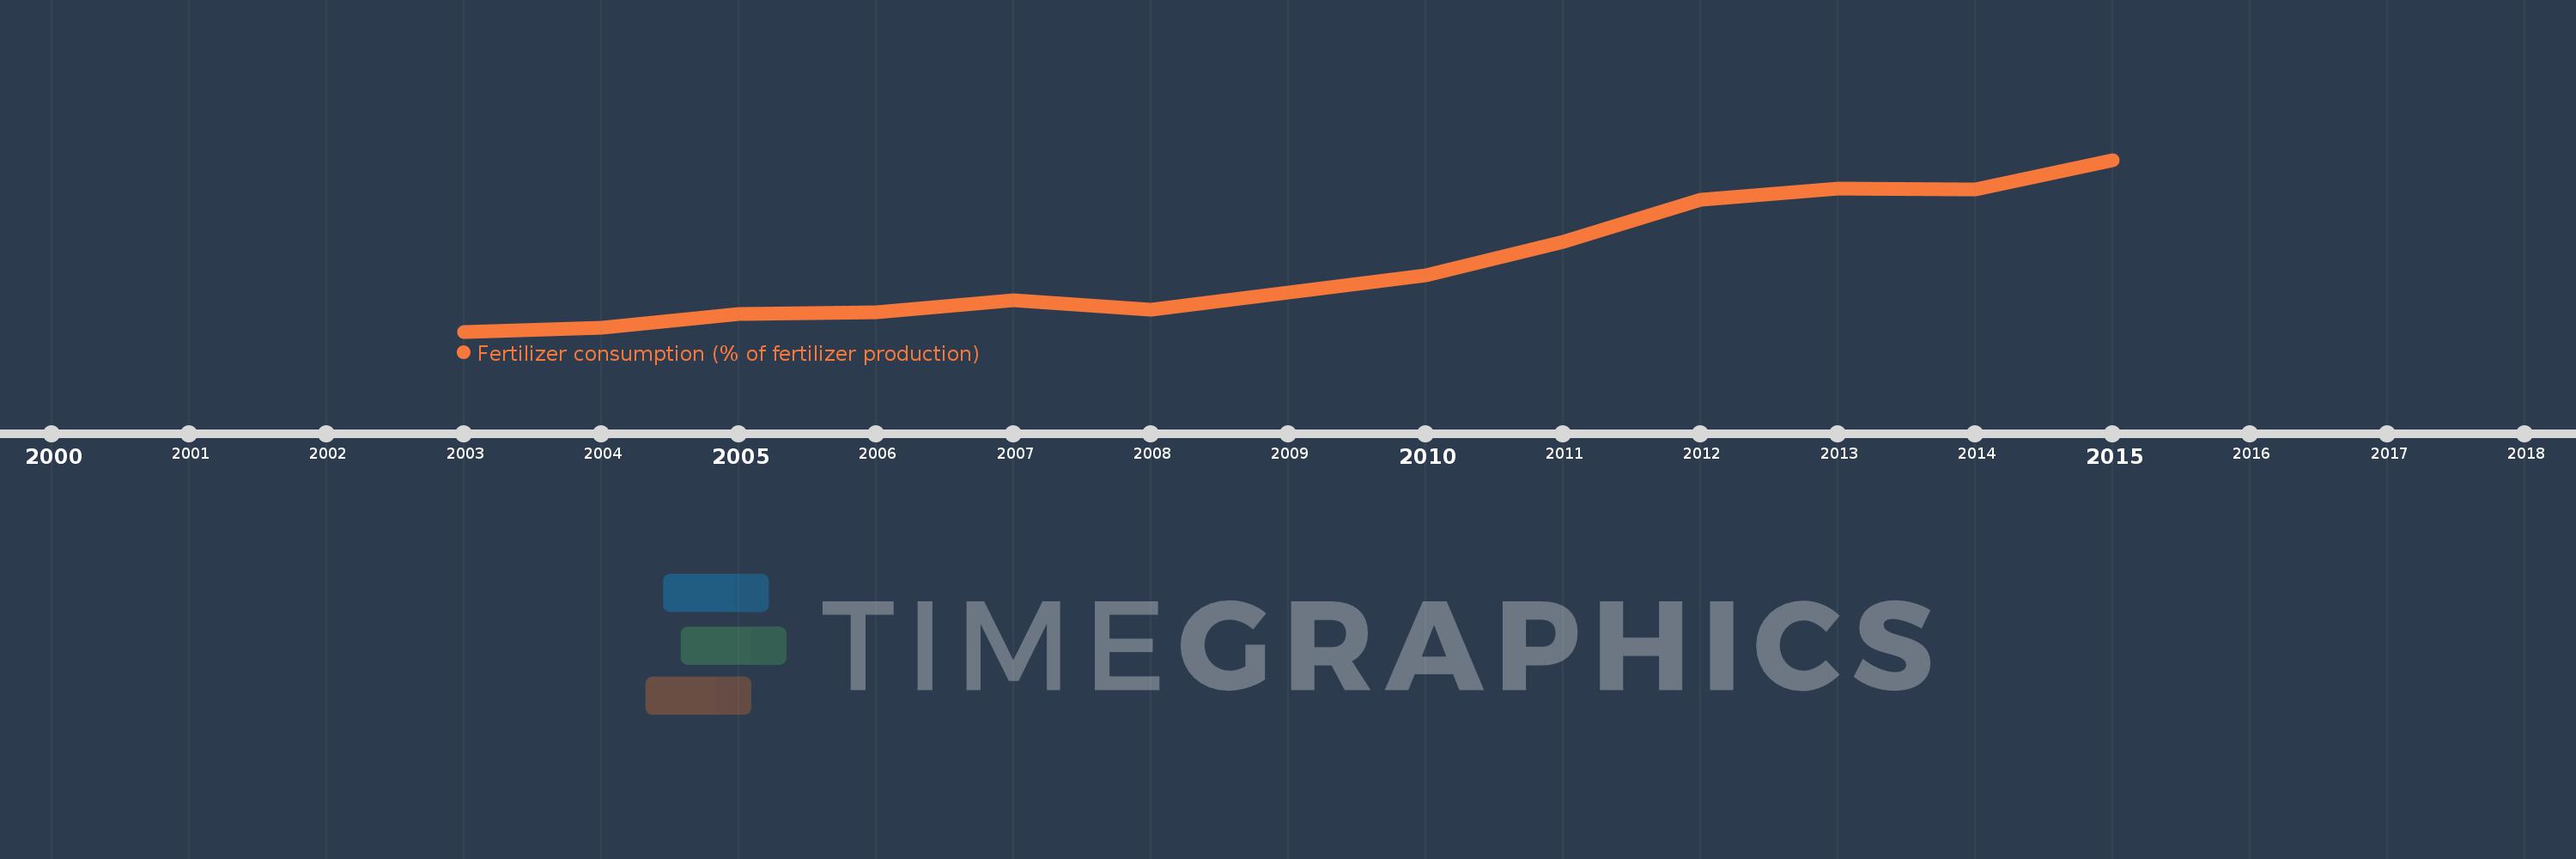
This timeline shows a graph from 2003 to 2015 of Least developed countries: UN classification. No data until 2002. Number of actual observations by date: 13.
Source name:
World Development Indicators
Source organization:
Food and Agriculture Organization, electronic files and web site.
Categories, topics:
Agriculture & Rural Development
Last updated:
apr 23, 2017
Indicators value changes by year
Meaning:
280.644
Minimum:
127.997
jan 1, 2003
Maximum:
520.173
jan 1, 2015
At the date of observation
Value
Absolute change
Change from the previous value
jan 1, 2003
127.997
+127.997
0.0%
jan 1, 2004
137.495
+9.498
7.42%
jan 1, 2005
169.038
+31.543
22.94%
jan 1, 2006
172.255
+3.217
1.9%
jan 1, 2007
199.253
+26.998
15.67%
jan 1, 2008
177.872
-21.382
-10.73%
jan 1, 2009
218.12
+40.248
22.63%
jan 1, 2010
257.18
+39.061
17.91%
jan 1, 2011
332.497
+75.317
29.29%
jan 1, 2012
429.648
+97.151
29.22%
jan 1, 2013
454.626
+24.978
5.81%
jan 1, 2014
452.215
-2.411
-0.53%
jan 1, 2015
520.173
+67.958
15.03%
Ranking of countries by current statistics by years