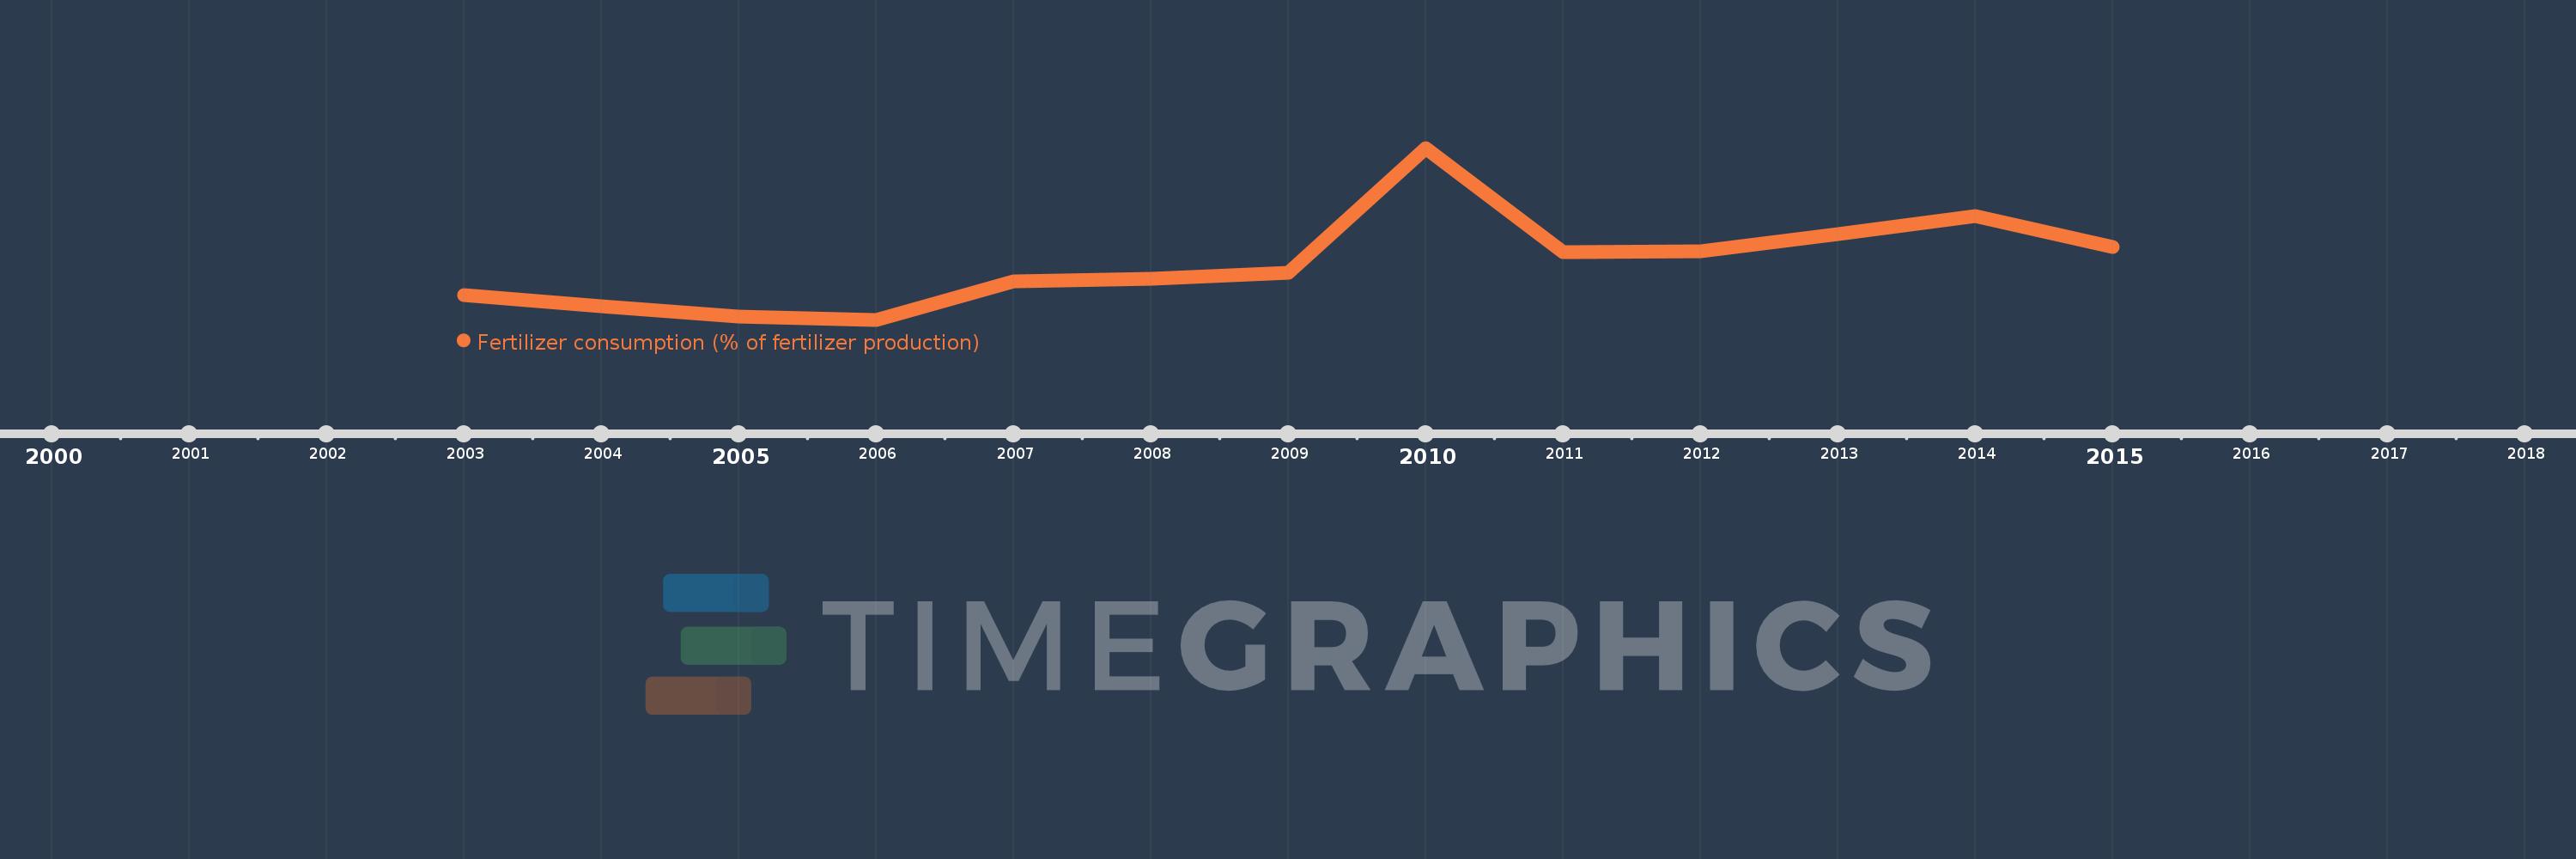
This timeline shows a graph from 2003 to 2015 of Europe & Central Asia (excluding high income). No data until 2002. Number of actual observations by date: 13.
Source name:
World Development Indicators
Source organization:
Food and Agriculture Organization, electronic files and web site.
Categories, topics:
Agriculture & Rural Development
Last updated:
apr 23, 2017
Indicators value changes by year
Meaning:
28.815
Minimum:
20.726
jan 1, 2006
Maximum:
45.213
jan 1, 2010
At the date of observation
Value
Absolute change
Change from the previous value
jan 1, 2003
24.296
+24.296
0.0%
jan 1, 2004
22.611
-1.684
-6.93%
jan 1, 2005
21.129
-1.482
-6.56%
jan 1, 2006
20.726
-0.403
-1.91%
jan 1, 2007
26.168
+5.443
26.26%
jan 1, 2008
26.602
+0.433
1.66%
jan 1, 2009
27.394
+0.793
2.98%
jan 1, 2010
45.213
+17.819
65.05%
jan 1, 2011
30.405
-14.809
-32.75%
jan 1, 2012
30.484
+0.08
0.26%
jan 1, 2013
32.989
+2.505
8.22%
jan 1, 2014
35.516
+2.526
7.66%
jan 1, 2015
31.062
-4.454
-12.54%
Ranking of countries by current statistics by years