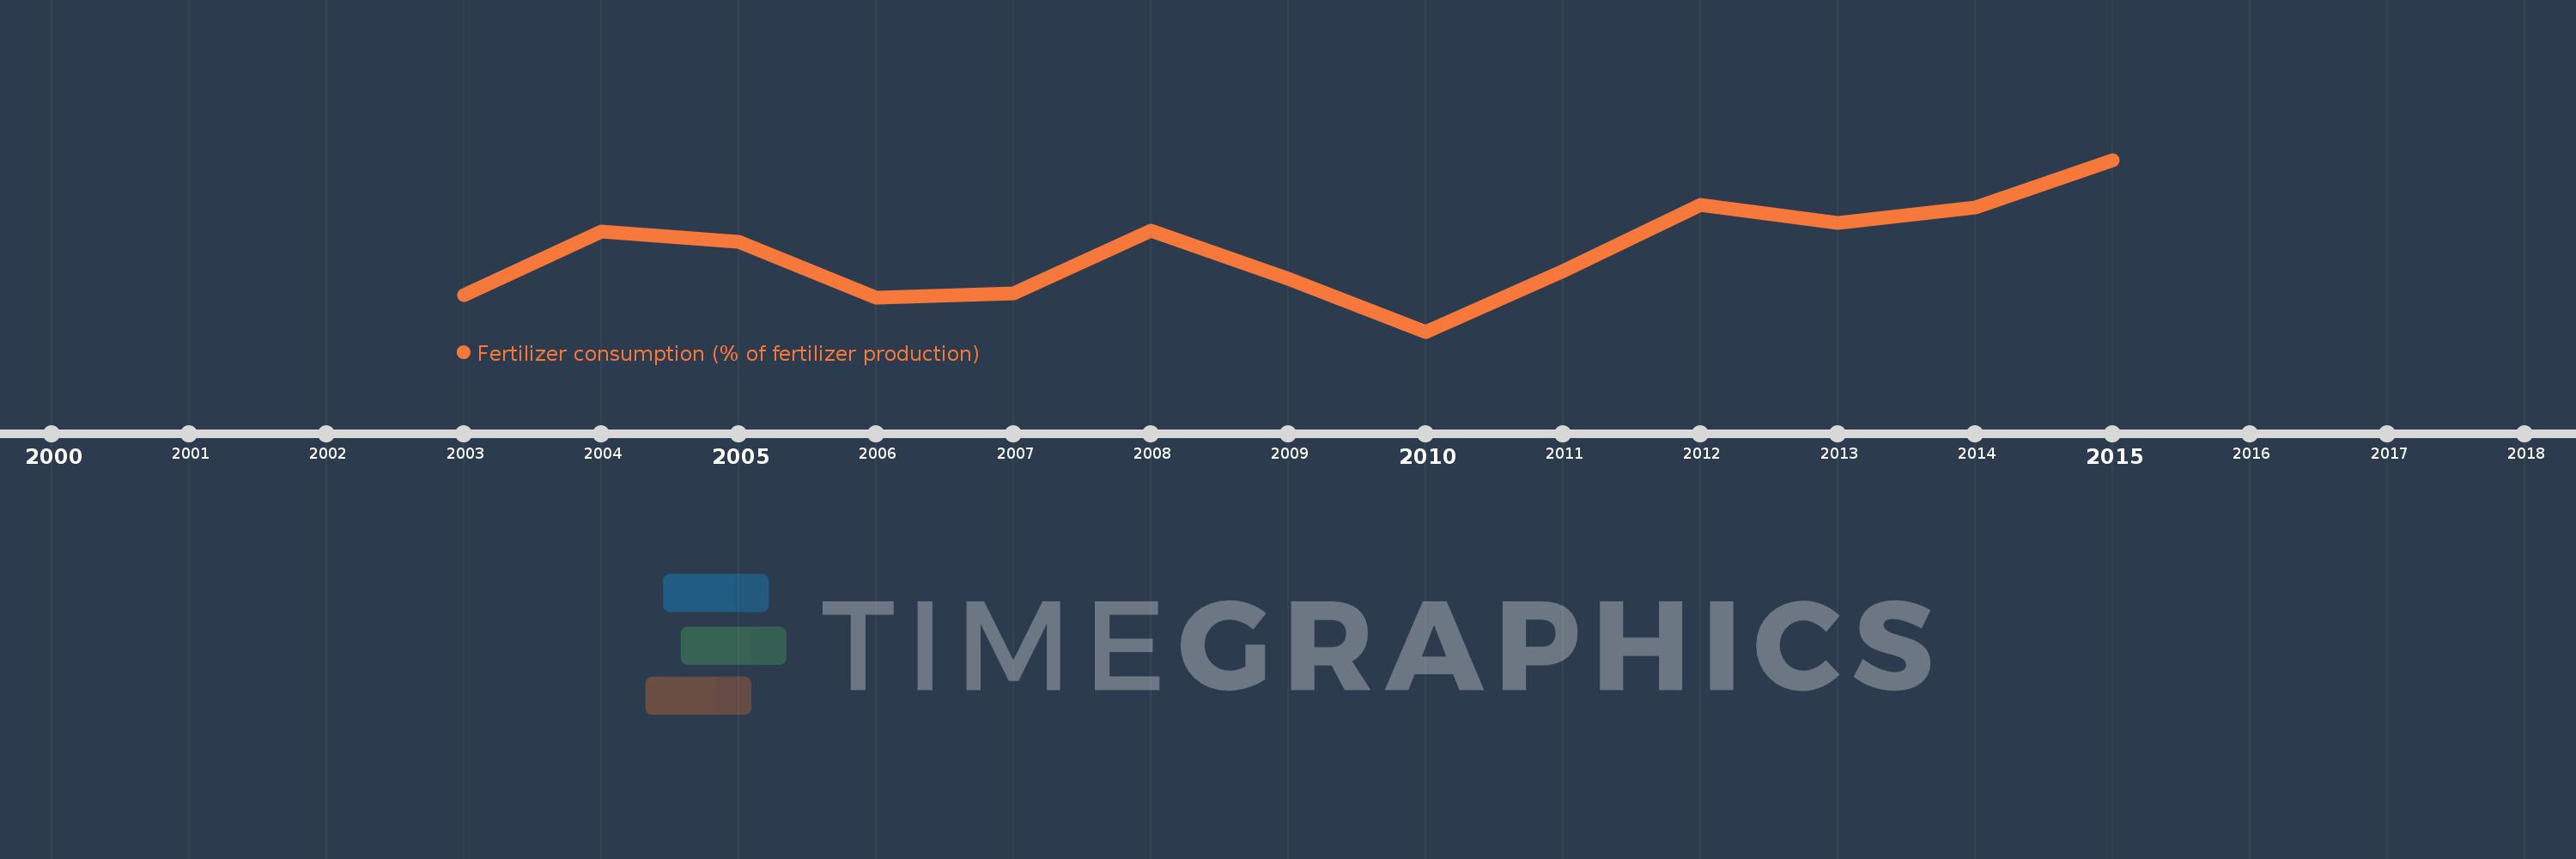
This timeline shows a graph from 2003 to 2015 of Latin America & Caribbean (excluding high income). No data until 2002. Number of actual observations by date: 13.
Source name:
World Development Indicators
Source organization:
Food and Agriculture Organization, electronic files and web site.
Categories, topics:
Agriculture & Rural Development
Last updated:
apr 23, 2017
Indicators value changes by year
Meaning:
289.484
Minimum:
233.659
jan 1, 2010
Maximum:
353.168
jan 1, 2015
At the date of observation
Value
Absolute change
Change from the previous value
jan 1, 2003
258.92
+258.92
0.0%
jan 1, 2004
303.526
+44.606
17.23%
jan 1, 2005
296.123
-7.403
-2.44%
jan 1, 2006
257.01
-39.112
-13.21%
jan 1, 2007
259.976
+2.966
1.15%
jan 1, 2008
303.674
+43.698
16.81%
jan 1, 2009
270.635
-33.039
-10.88%
jan 1, 2010
233.659
-36.976
-13.66%
jan 1, 2011
275.549
+41.891
17.93%
jan 1, 2012
321.594
+46.044
16.71%
jan 1, 2013
309.441
-12.152
-3.78%
jan 1, 2014
320.015
+10.574
3.42%
jan 1, 2015
353.168
+33.153
10.36%
Ranking of countries by current statistics by years