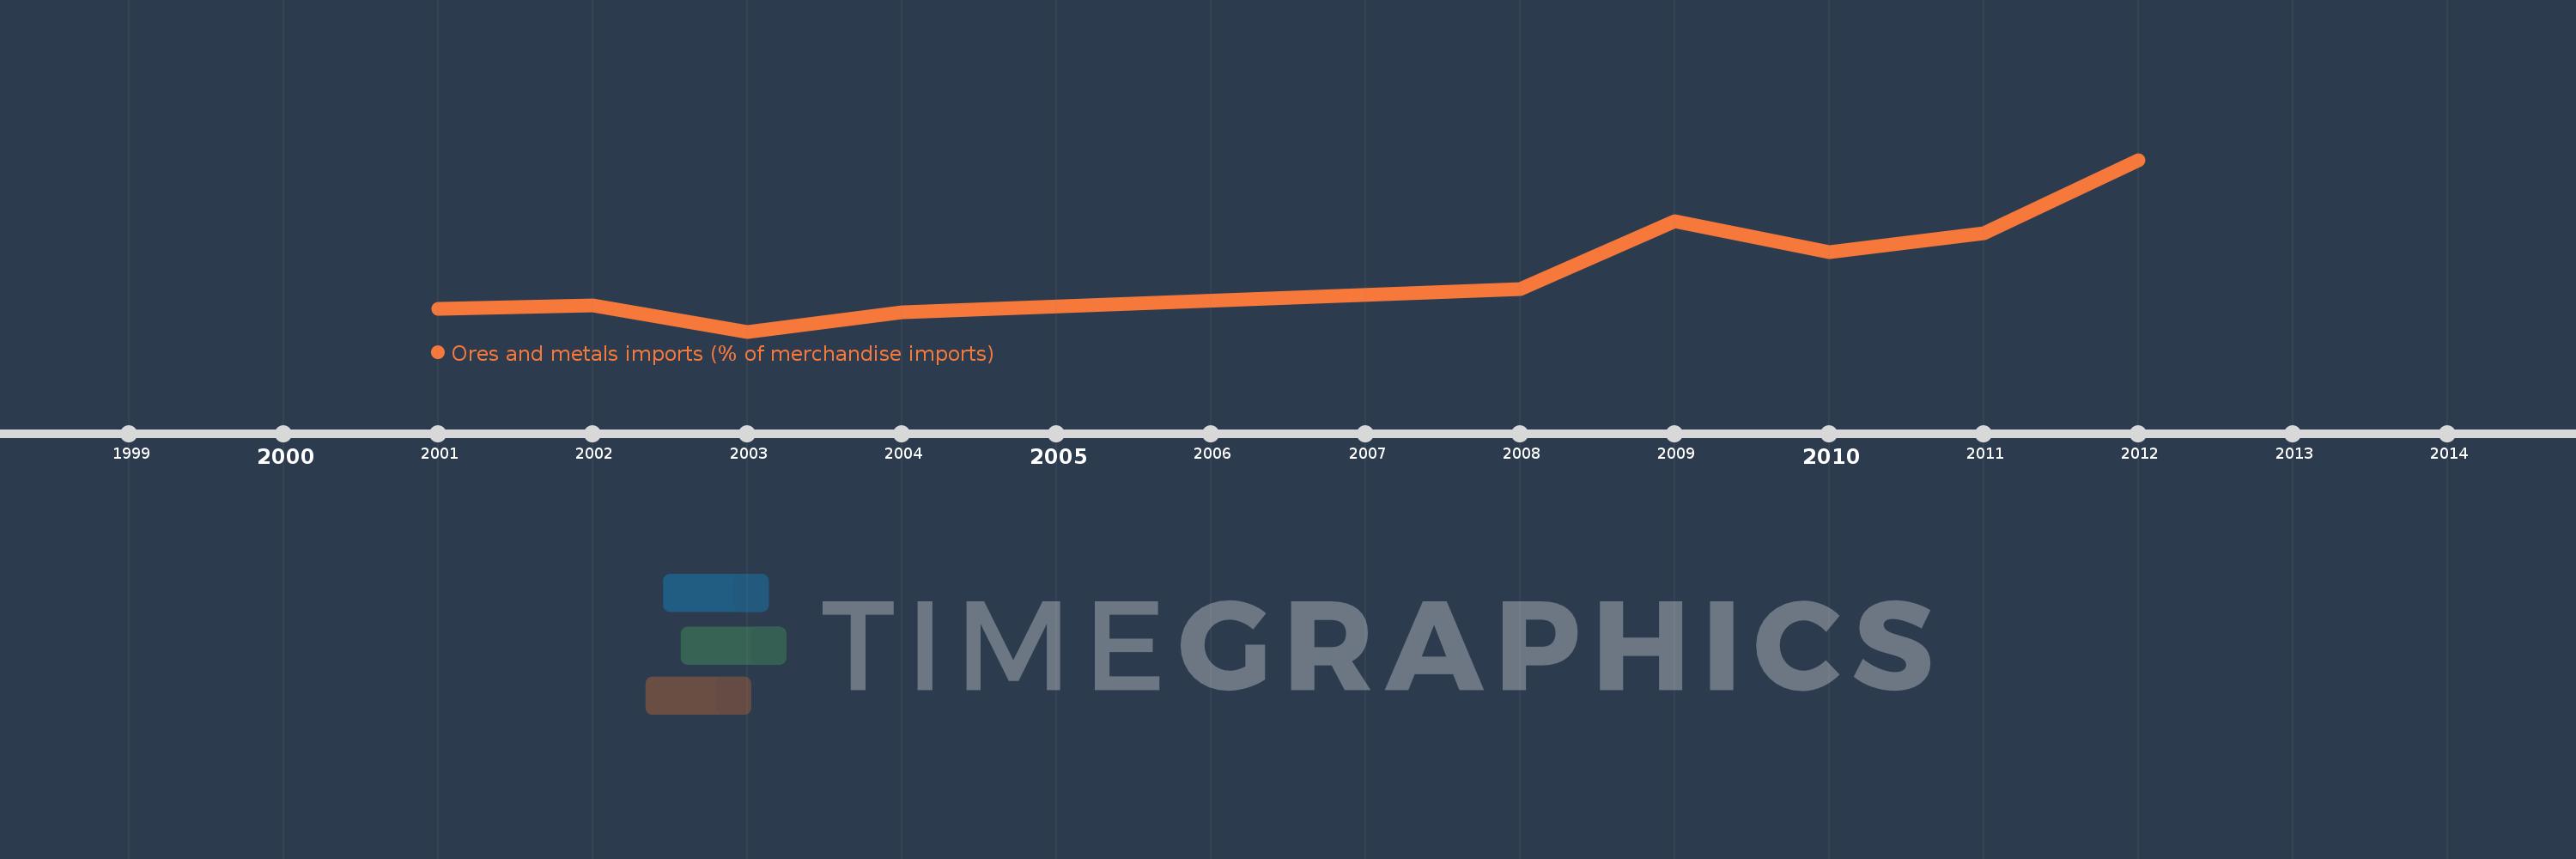
This timeline shows a graph from 2001 to 2012 of Least developed countries: UN classification. No data until 2000. Number of actual observations by date: 9.
Source name:
World Development Indicators
Source organization:
World Bank staff estimates from the Comtrade database maintained by the United Nations Statistics Division.
Categories, topics:
Energy & Mining, Private Sector, Trade
Last updated:
apr 23, 2017
Indicators value changes by year
Meaning:
1.777
Minimum:
1.358
jan 1, 2003
Maximum:
2.493
jan 1, 2012
At the date of observation
Value
Absolute change
Change from the previous value
jan 1, 2001
1.511
+1.511
0.0%
jan 1, 2002
1.53
+0.019
1.25%
jan 1, 2003
1.358
-0.172
-11.25%
jan 1, 2004
1.487
+0.13
9.56%
jan 1, 2008
1.637
+0.149
10.05%
jan 1, 2009
2.09
+0.453
27.65%
jan 1, 2010
1.881
-0.209
-9.99%
jan 1, 2011
2.007
+0.126
6.72%
jan 1, 2012
2.493
+0.486
24.2%
Ranking of countries by current statistics by years