33
/
AIzaSyB4mHJ5NPEv-XzF7P6NDYXjlkCWaeKw5bc
November 30, 2025
243976
Solomon Islands
SLB
true
2
1
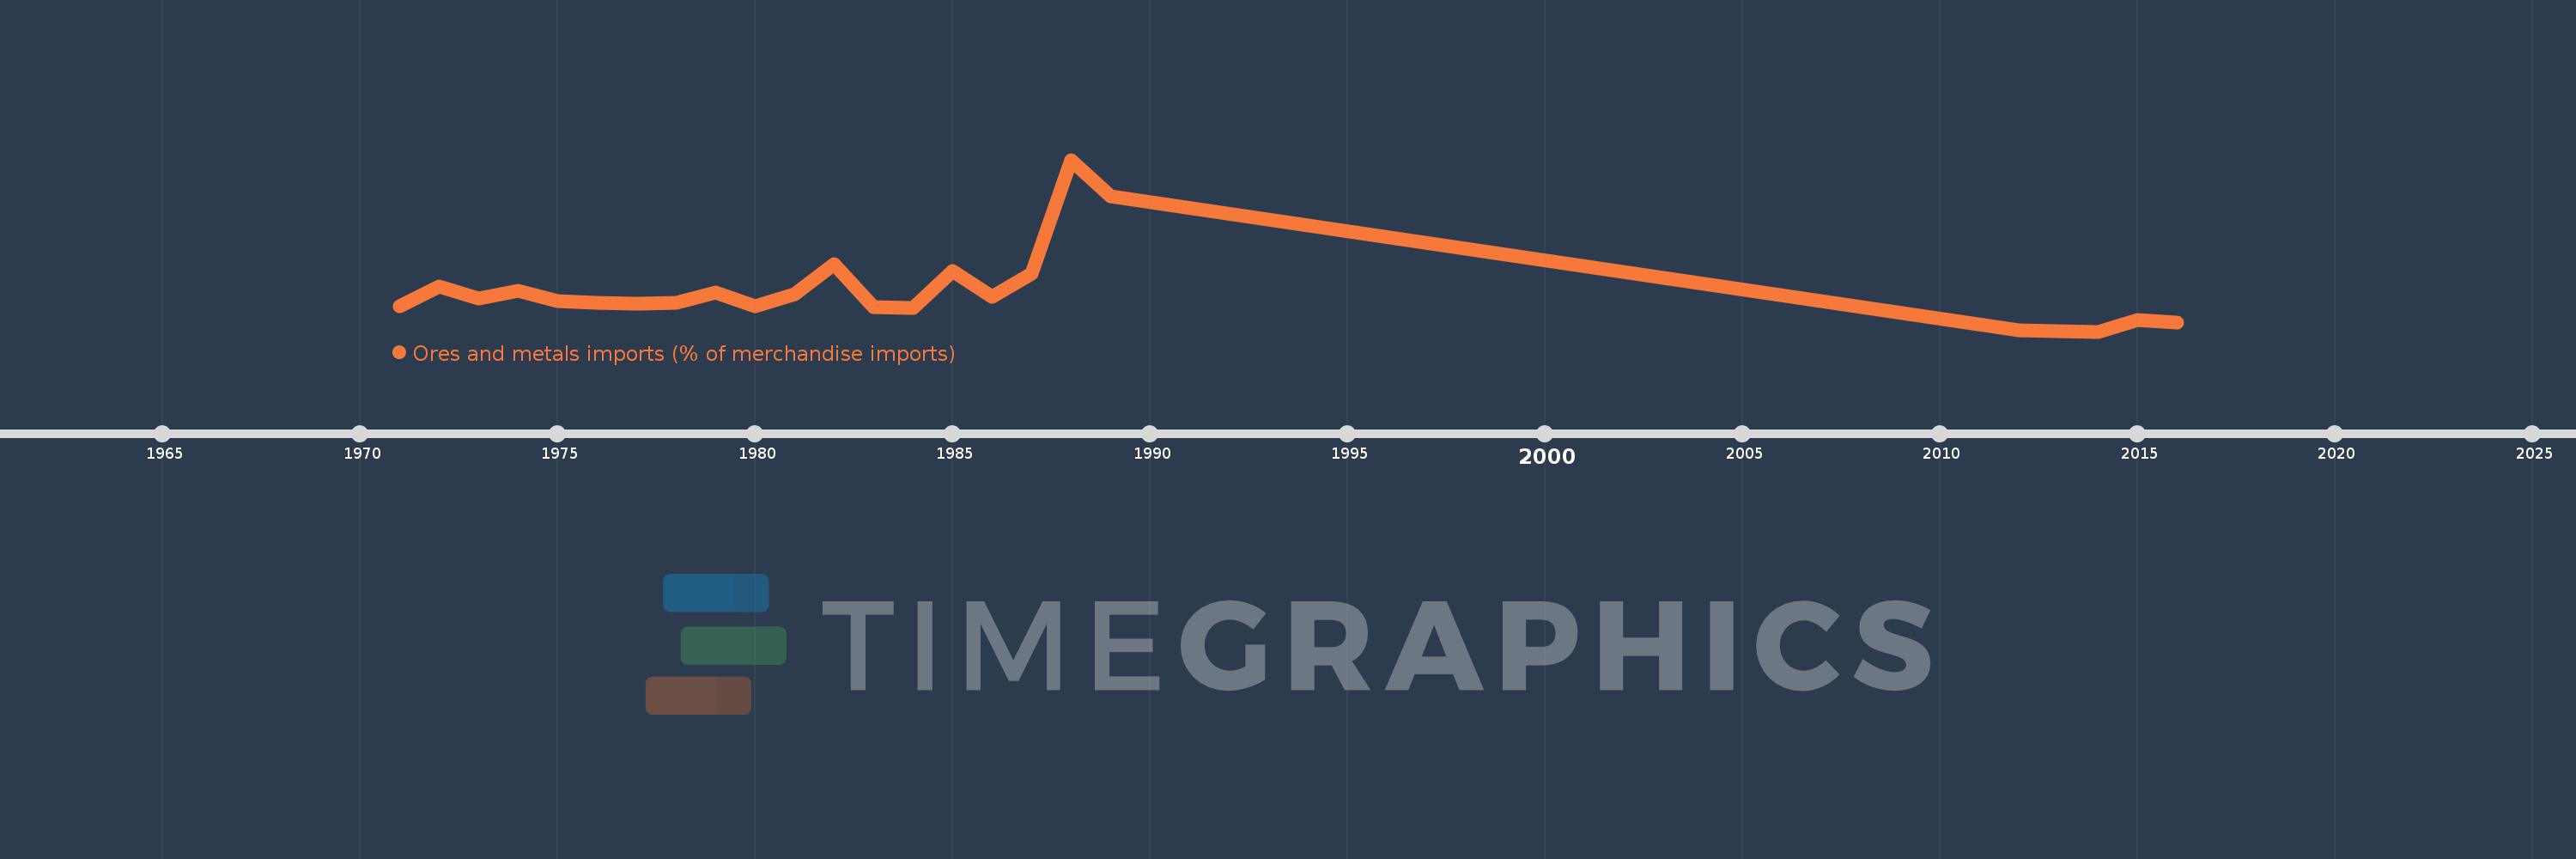
Ores and metals imports (% of merchandise imports)
2016,2015,2014,2012,1989,1988,1987,1986,1985,1984,1983,1982,1981,1980,1979,1978,1977,1976,1975,1974,1973,1972,1971