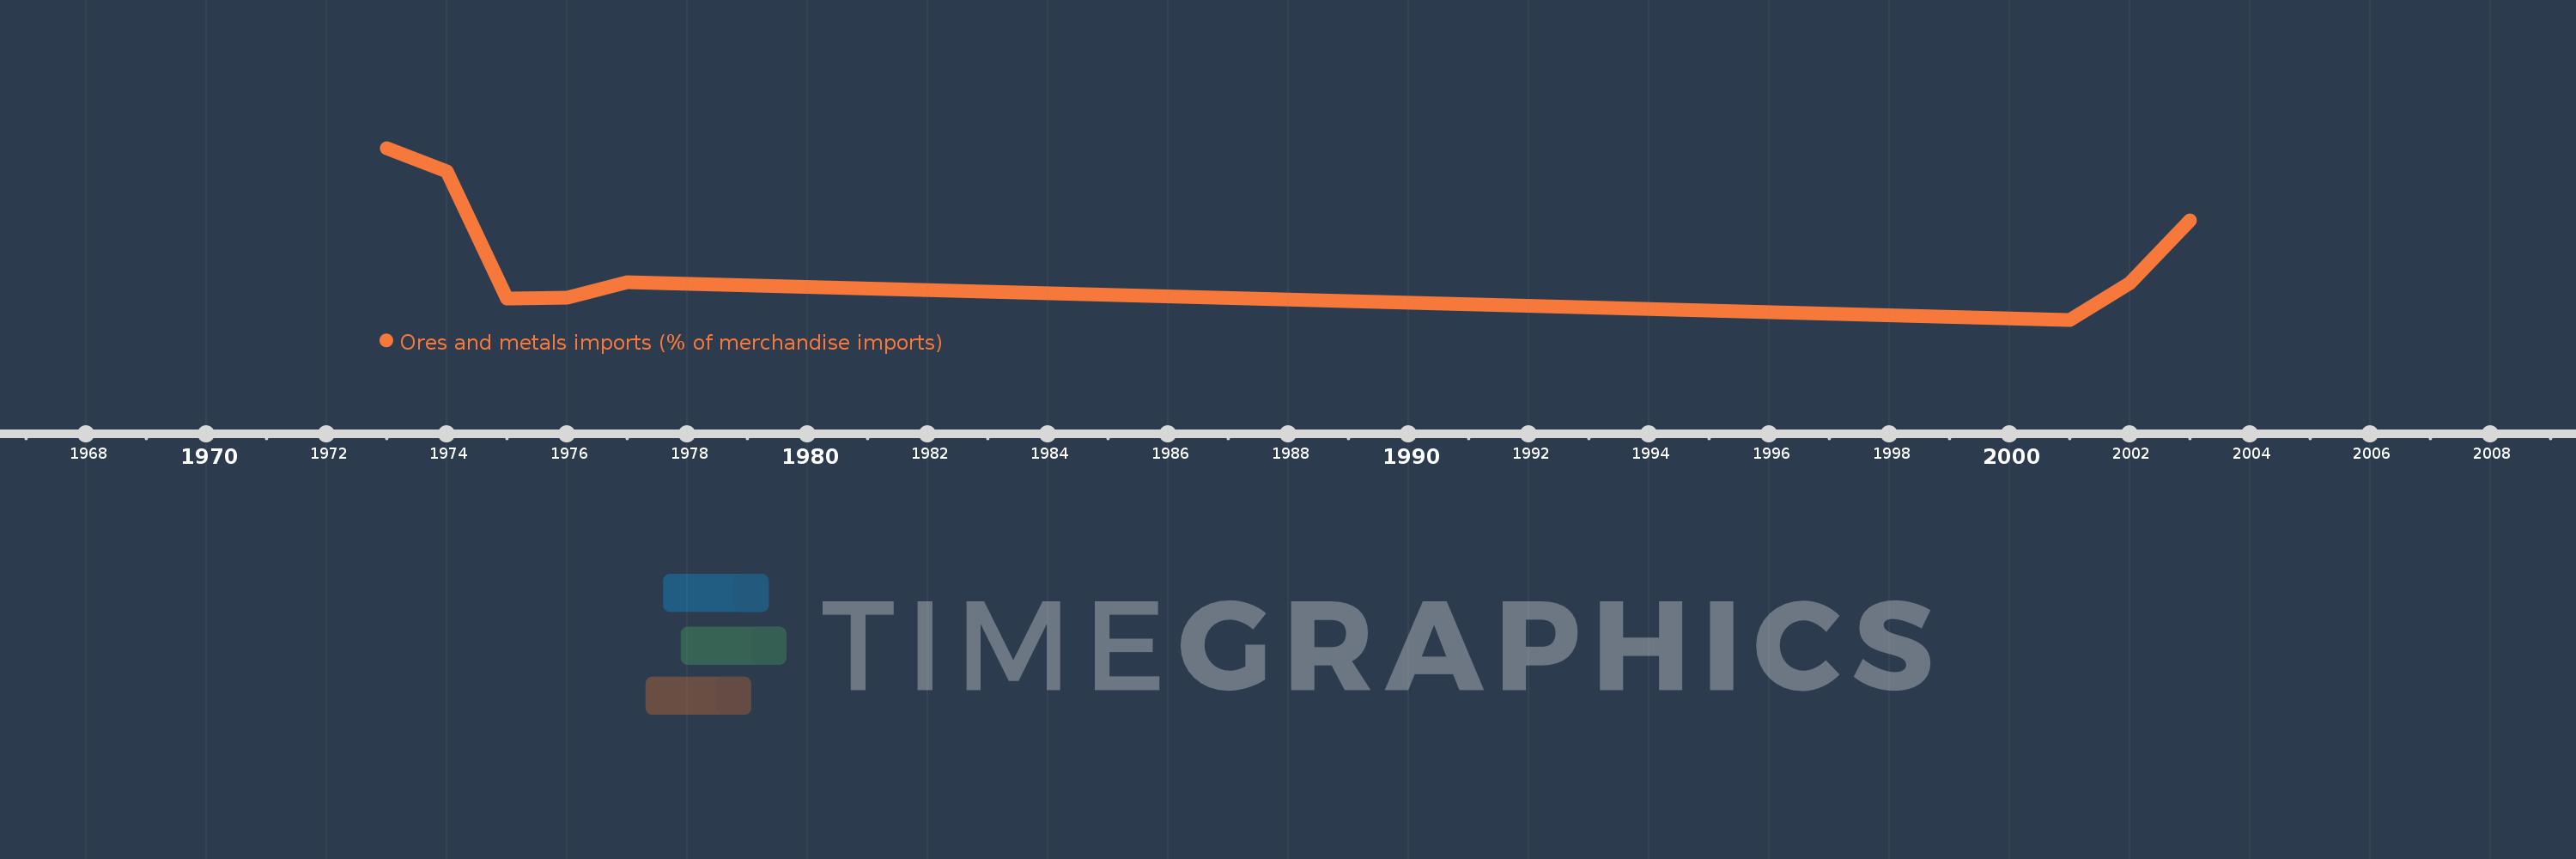
This timeline shows a graph from 1973 to 2003 of Fragile and conflict affected situations. No data until 1972. Number of actual observations by date: 8.
Source name:
World Development Indicators
Source organization:
World Bank staff estimates from the Comtrade database maintained by the United Nations Statistics Division.
Categories, topics:
Energy & Mining, Private Sector, Trade
Last updated:
apr 23, 2017
Indicators value changes by year
Meaning:
1.18
Minimum:
0.978
jan 1, 2001
Maximum:
1.495
jan 1, 1973
At the date of observation
Value
Absolute change
Change from the previous value
jan 1, 1973
1.495
+1.495
0.0%
jan 1, 1974
1.424
-0.071
-4.74%
jan 1, 1975
1.041
-0.382
-26.86%
jan 1, 1976
1.045
+0.004
0.39%
jan 1, 1977
1.091
+0.046
4.39%
jan 1, 2001
0.978
-0.113
-10.34%
jan 1, 2002
1.089
+0.111
11.31%
jan 1, 2003
1.276
+0.187
17.15%
Ranking of countries by current statistics by years