33
/
AIzaSyB4mHJ5NPEv-XzF7P6NDYXjlkCWaeKw5bc
November 30, 2025
287646
Zimbabwe
ZWE
true
2
1
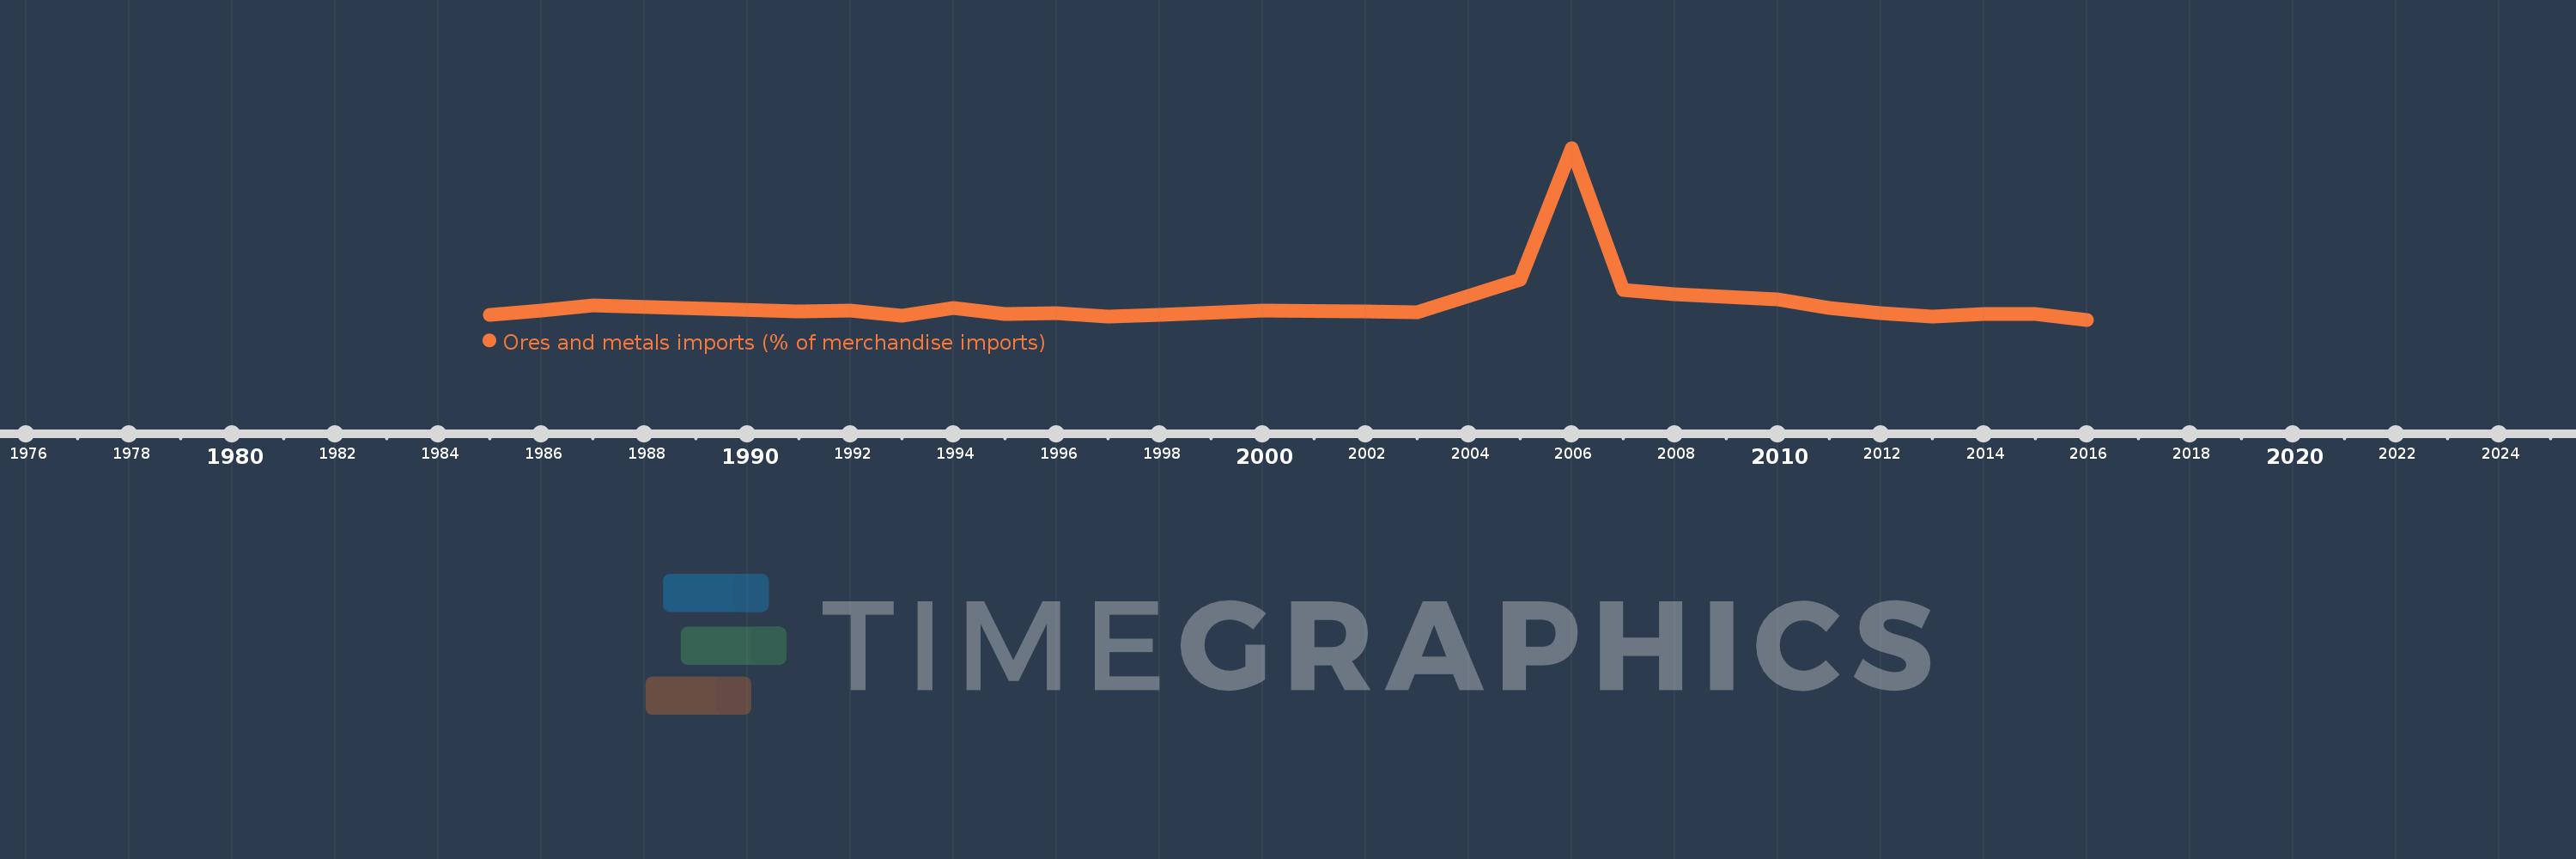
Ores and metals imports (% of merchandise imports)
2016,2015,2014,2013,2012,2011,2010,2009,2008,2007,2006,2005,2003,2002,2000,1998,1997,1996,1995,1994,1993,1992,1991,1987,1986,1985