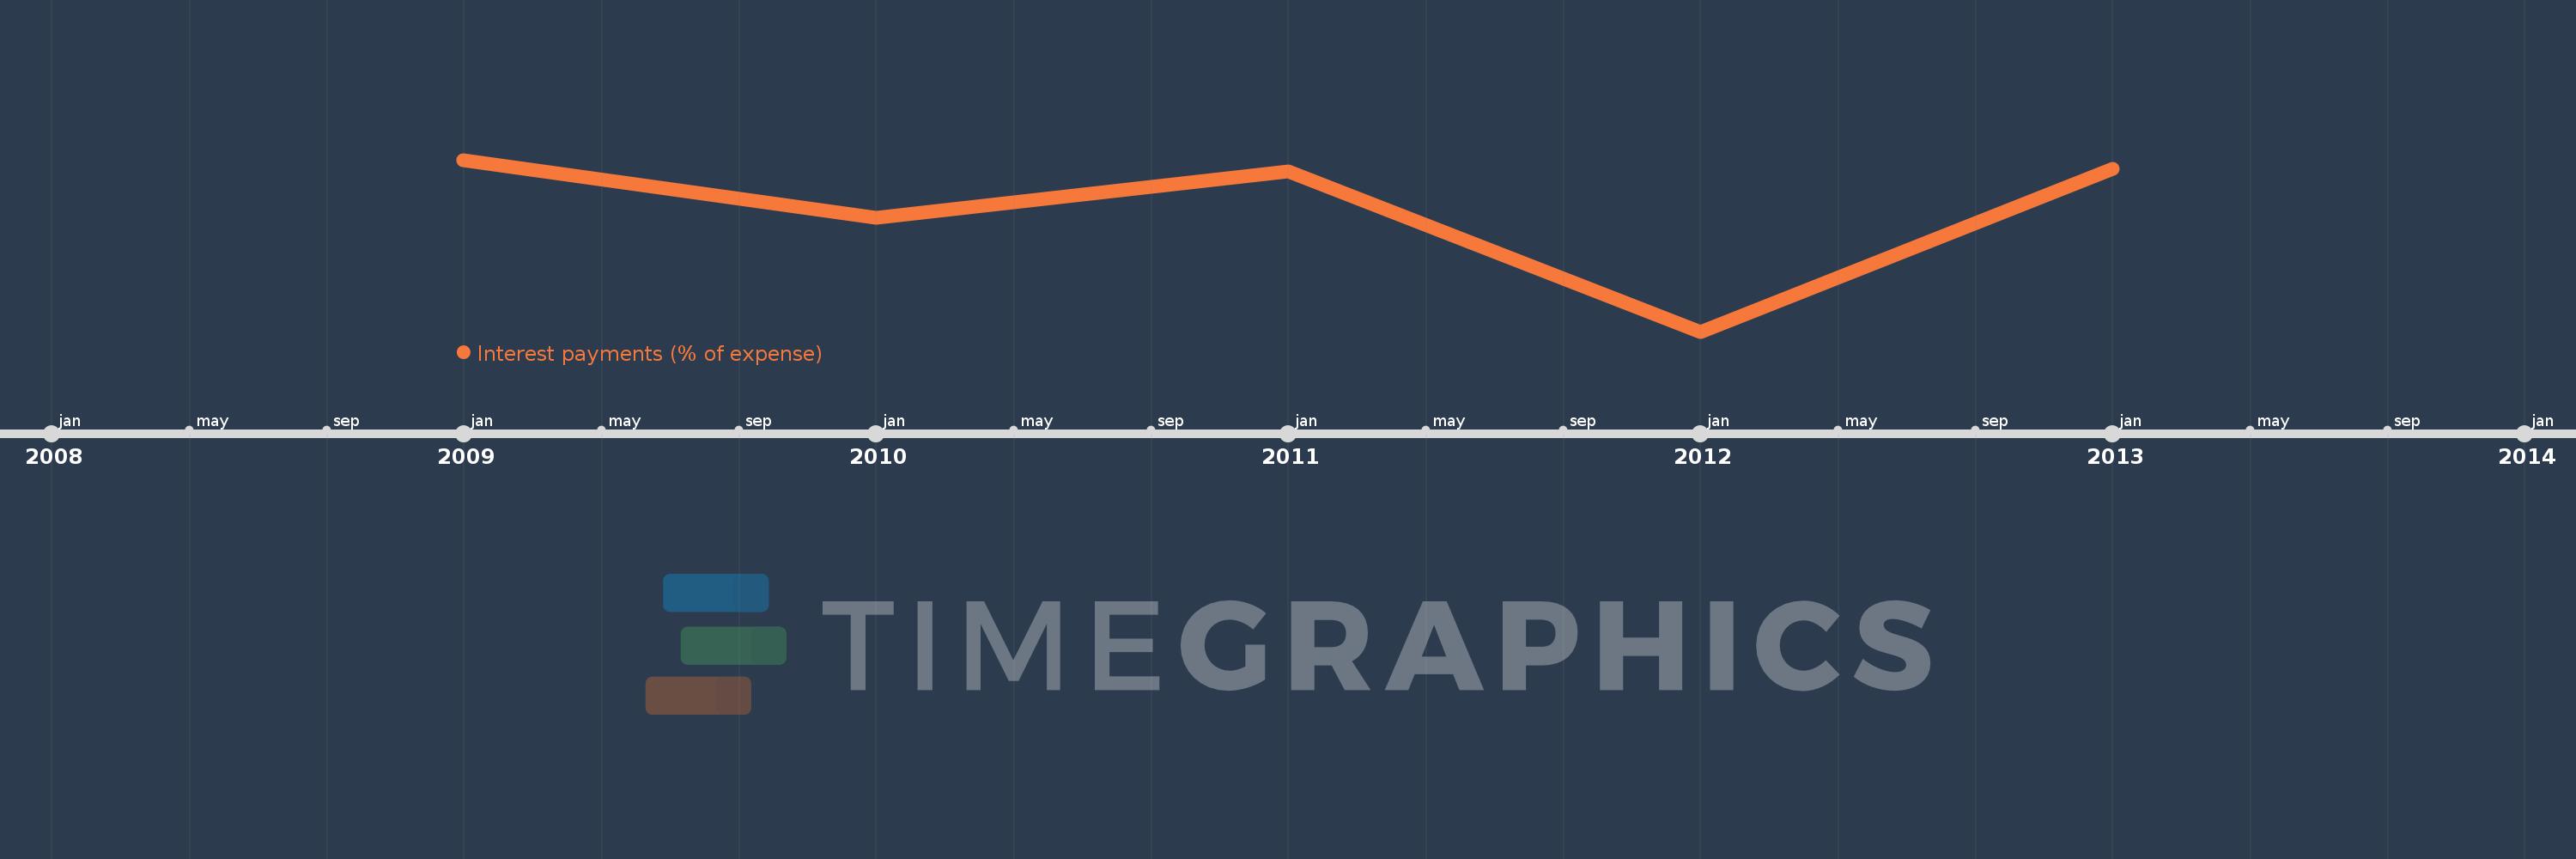
This timeline shows a graph from 2009 to 2013 of Least developed countries: UN classification. No data until 2008. Number of actual observations by date: 5.
Source name:
World Development Indicators
Source organization:
International Monetary Fund, Government Finance Statistics Yearbook and data files.
Categories, topics:
Public Sector
Last updated:
apr 23, 2017
Indicators value changes by year
Meaning:
5.001
Minimum:
4.509
jan 1, 2012
Maximum:
5.204
jan 1, 2009
At the date of observation
Value
Absolute change
Change from the previous value
jan 1, 2009
5.204
+5.204
0.0%
jan 1, 2010
4.969
-0.235
-4.51%
jan 1, 2011
5.156
+0.187
3.76%
jan 1, 2012
4.509
-0.647
-12.55%
jan 1, 2013
5.168
+0.66
14.63%
Ranking of countries by current statistics by years