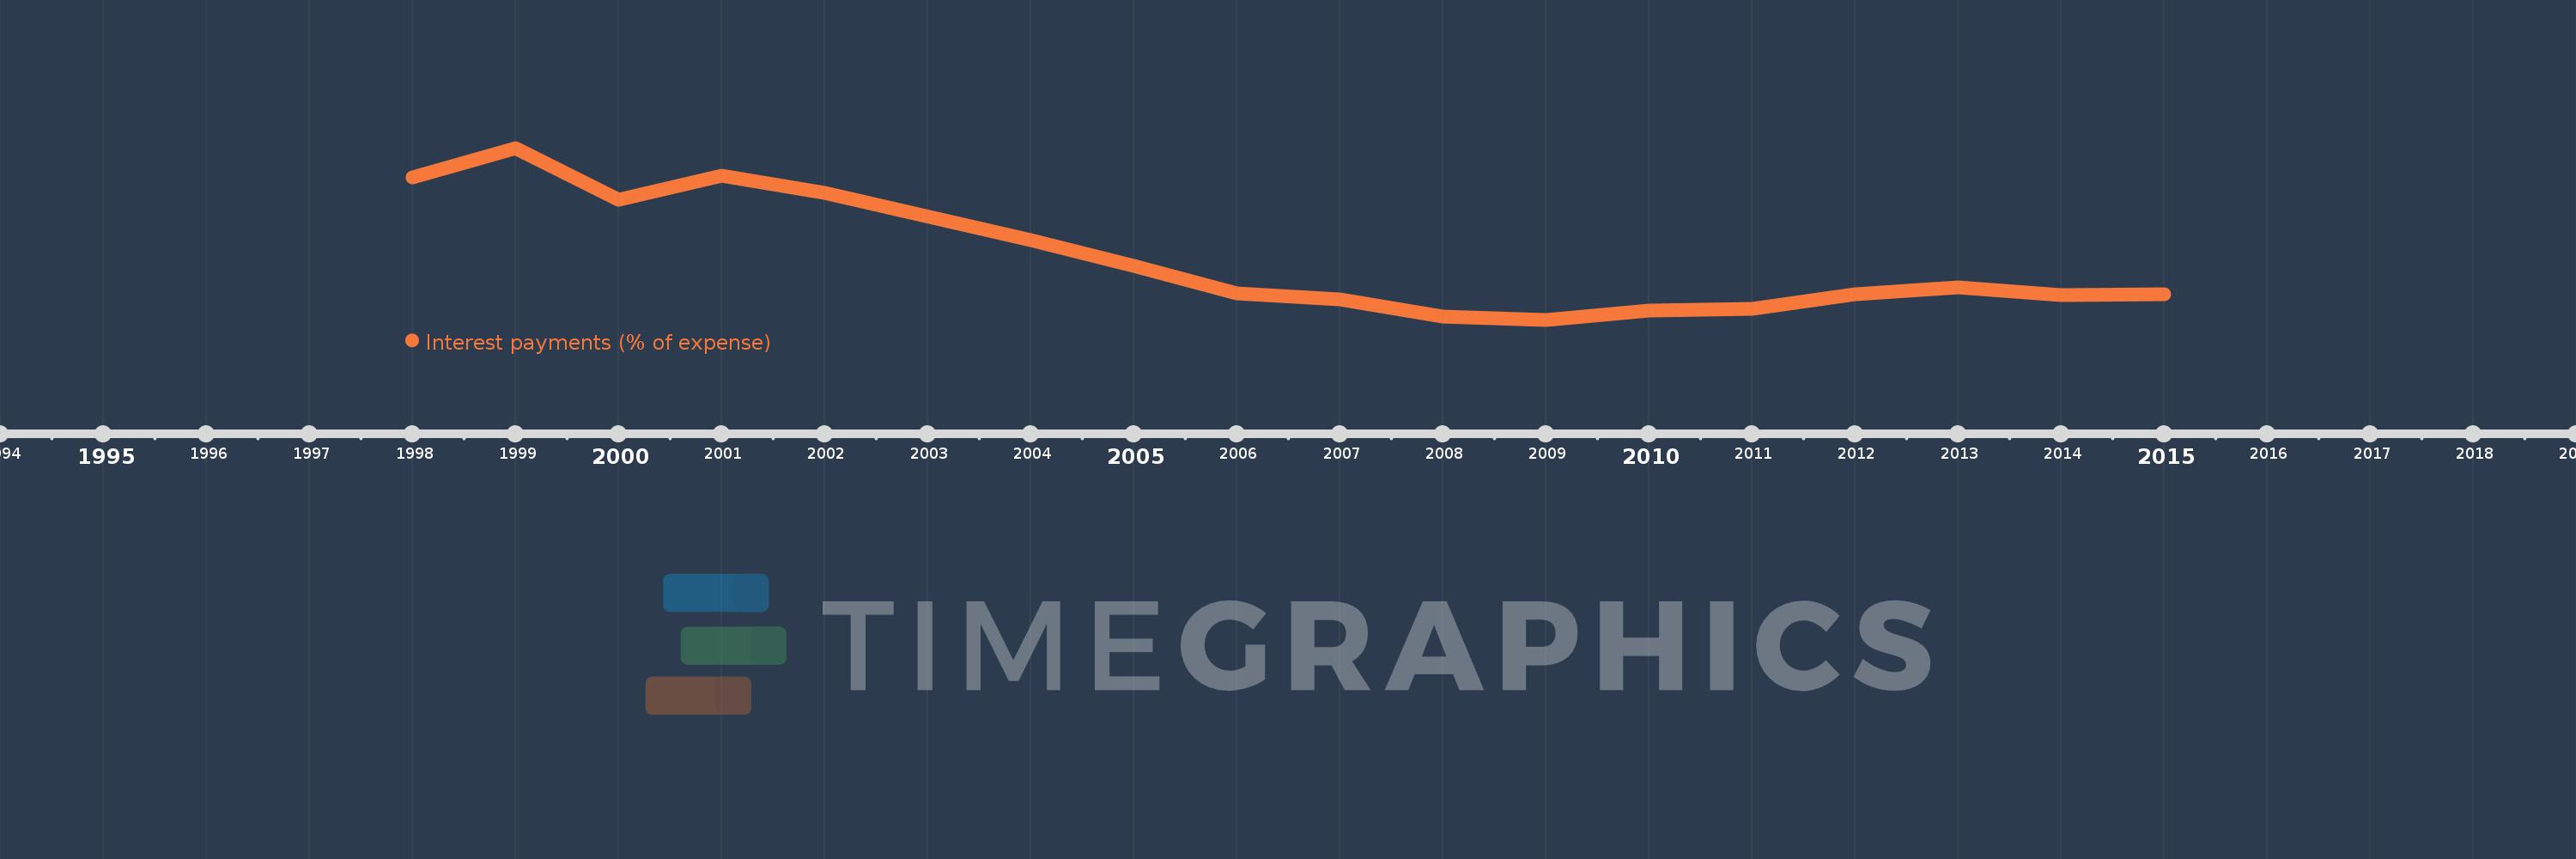
This timeline shows a graph from 1998 to 2015 of Europe & Central Asia (excluding high income). No data until 1997. Number of actual observations by date: 17.
Source name:
World Development Indicators
Source organization:
International Monetary Fund, Government Finance Statistics Yearbook and data files.
Categories, topics:
Public Sector
Last updated:
apr 23, 2017
Indicators value changes by year
Meaning:
5.427
Minimum:
1.724
jan 1, 2009
Maximum:
12.348
jan 1, 1999
At the date of observation
Value
Absolute change
Change from the previous value
jan 1, 1998
10.536
+10.536
0.0%
jan 1, 1999
12.348
+1.812
17.2%
jan 1, 2000
9.168
-3.18
-25.75%
jan 1, 2001
10.619
+1.451
15.83%
jan 1, 2002
9.589
-1.03
-9.7%
jan 1, 2004
6.666
-2.923
-30.48%
jan 1, 2005
5.06
-1.607
-24.1%
jan 1, 2006
3.367
-1.693
-33.46%
jan 1, 2007
3.005
-0.362
-10.74%
jan 1, 2008
1.905
-1.1
-36.6%
jan 1, 2009
1.724
-0.181
-9.51%
jan 1, 2010
2.272
+0.548
31.79%
jan 1, 2011
2.412
+0.14
6.18%
jan 1, 2012
3.277
+0.864
35.83%
jan 1, 2013
3.739
+0.462
14.09%
jan 1, 2014
3.253
-0.486
-13.0%
jan 1, 2015
3.318
+0.066
2.02%
Ranking of countries by current statistics by years