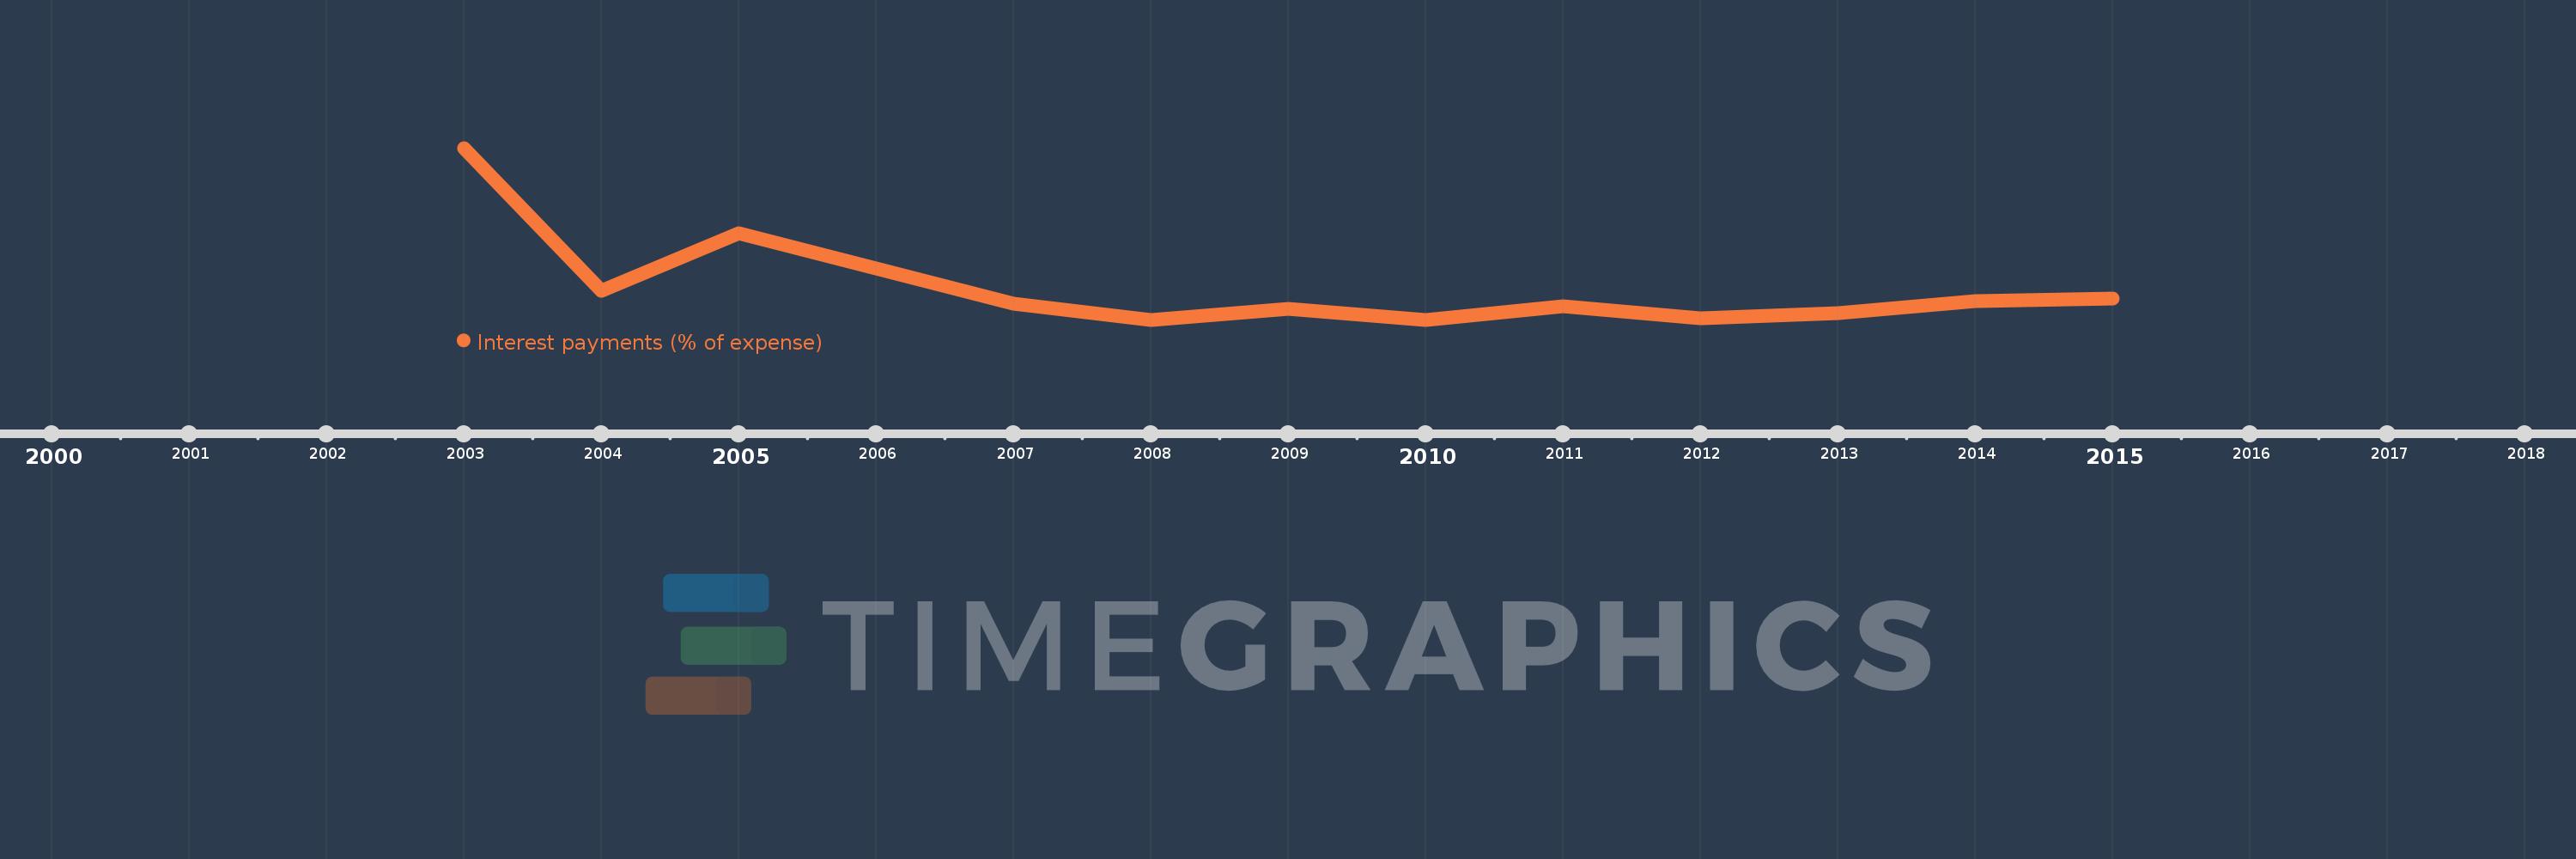
This timeline shows a graph from 2003 to 2015 of East Asia & Pacific (IDA & IBRD countries). No data until 2002. Number of actual observations by date: 12.
Source name:
World Development Indicators
Source organization:
International Monetary Fund, Government Finance Statistics Yearbook and data files.
Categories, topics:
Public Sector
Last updated:
apr 23, 2017
Indicators value changes by year
Meaning:
7.314
Minimum:
5.765
jan 1, 2010
Maximum:
14.276
jan 1, 2003
At the date of observation
Value
Absolute change
Change from the previous value
jan 1, 2003
14.276
+14.276
0.0%
jan 1, 2004
7.205
-7.071
-49.53%
jan 1, 2005
10.048
+2.843
39.46%
jan 1, 2007
6.581
-3.467
-34.5%
jan 1, 2008
5.771
-0.81
-12.31%
jan 1, 2009
6.292
+0.521
9.03%
jan 1, 2010
5.765
-0.527
-8.37%
jan 1, 2011
6.42
+0.655
11.36%
jan 1, 2012
5.83
-0.59
-9.19%
jan 1, 2013
6.072
+0.242
4.16%
jan 1, 2014
6.683
+0.611
10.07%
jan 1, 2015
6.823
+0.139
2.09%
Ranking of countries by current statistics by years