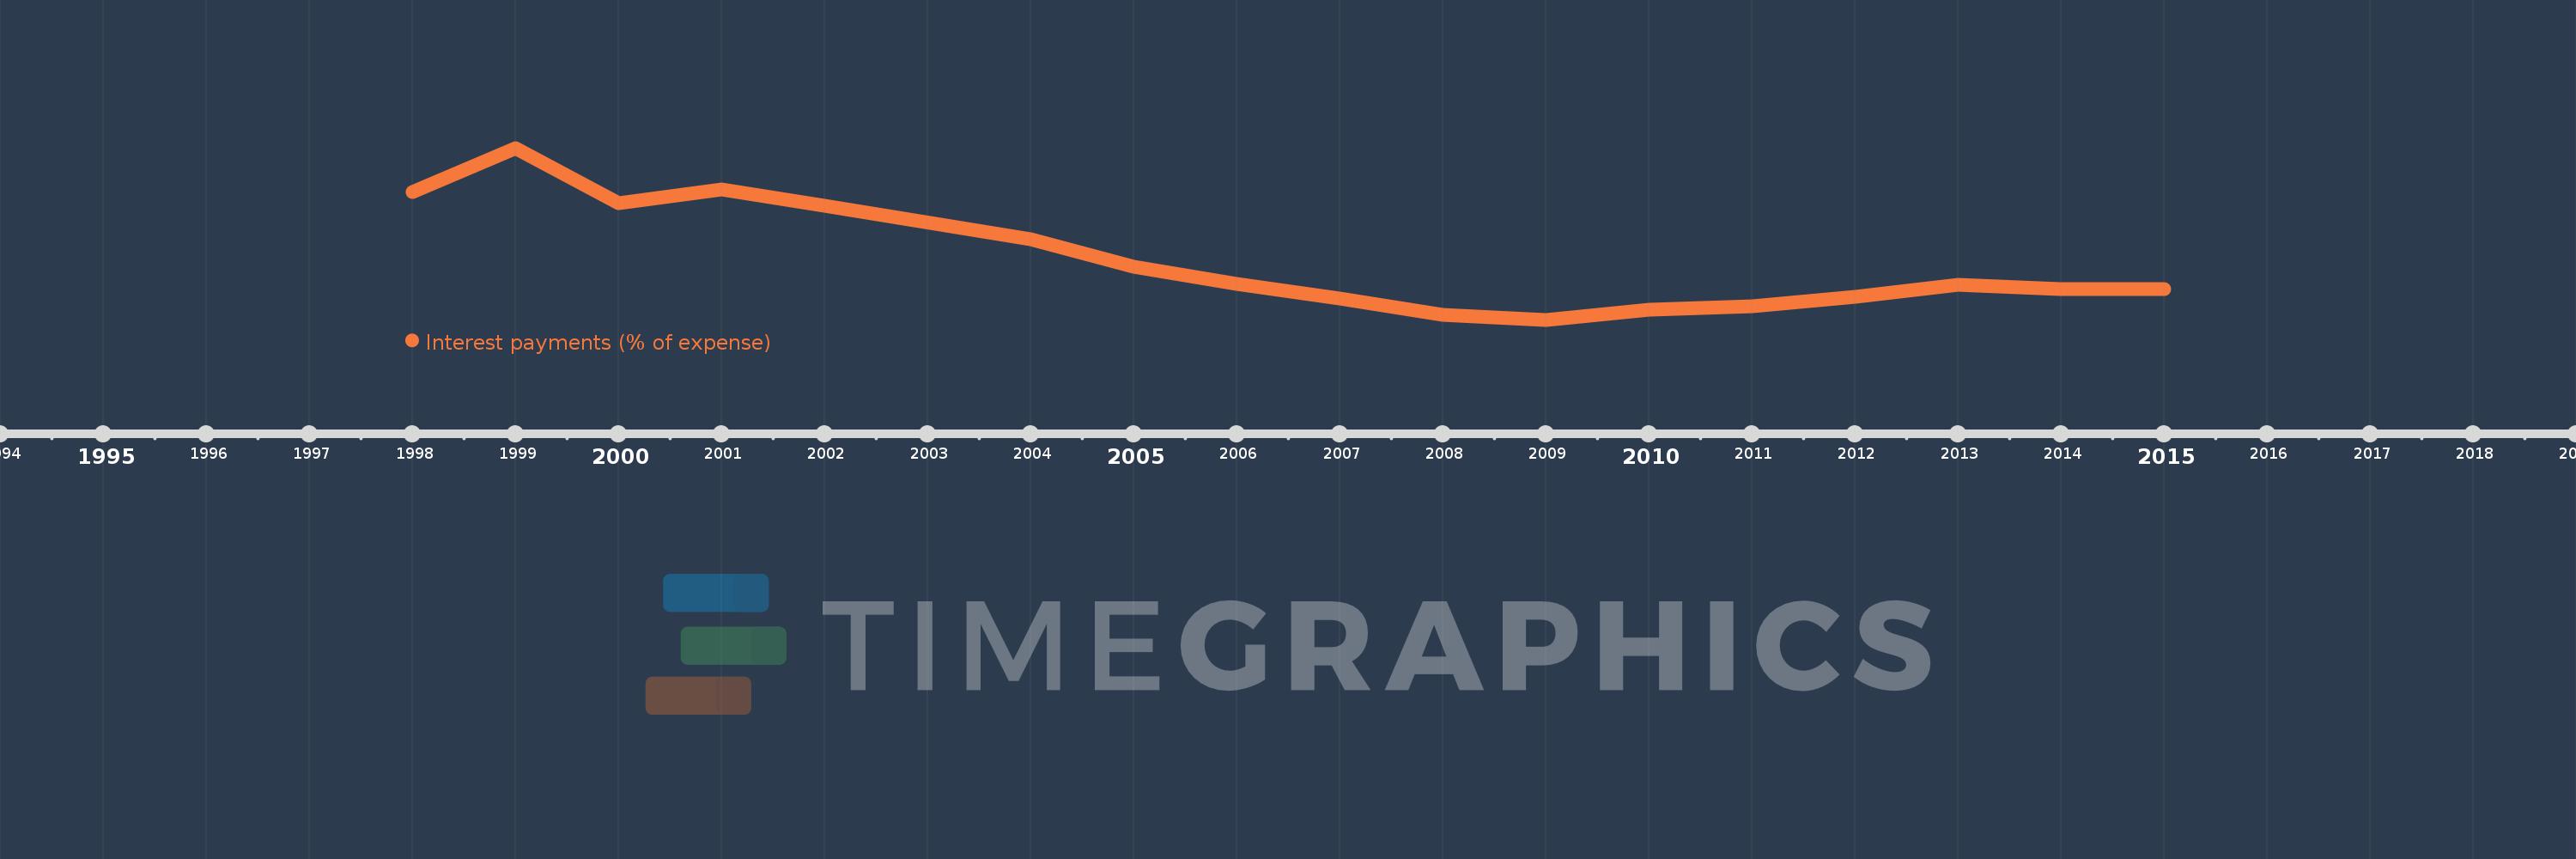
This timeline shows a graph from 1998 to 2015 of Europe & Central Asia (IDA & IBRD countries). No data until 1997. Number of actual observations by date: 17.
Source name:
World Development Indicators
Source organization:
International Monetary Fund, Government Finance Statistics Yearbook and data files.
Categories, topics:
Public Sector
Last updated:
apr 23, 2017
Indicators value changes by year
Meaning:
5.397
Minimum:
1.919
jan 1, 2009
Maximum:
12.097
jan 1, 1999
At the date of observation
Value
Absolute change
Change from the previous value
jan 1, 1998
9.483
+9.483
0.0%
jan 1, 1999
12.097
+2.613
27.56%
jan 1, 2000
8.835
-3.261
-26.96%
jan 1, 2001
9.623
+0.788
8.92%
jan 1, 2002
8.697
-0.926
-9.62%
jan 1, 2004
6.666
-2.031
-23.35%
jan 1, 2005
5.06
-1.607
-24.1%
jan 1, 2006
4.028
-1.032
-20.39%
jan 1, 2007
3.172
-0.856
-21.25%
jan 1, 2008
2.23
-0.943
-29.71%
jan 1, 2009
1.919
-0.311
-13.95%
jan 1, 2010
2.494
+0.575
29.99%
jan 1, 2011
2.74
+0.246
9.85%
jan 1, 2012
3.294
+0.554
20.23%
jan 1, 2013
3.972
+0.679
20.61%
jan 1, 2014
3.73
-0.242
-6.1%
jan 1, 2015
3.711
-0.019
-0.52%
Ranking of countries by current statistics by years