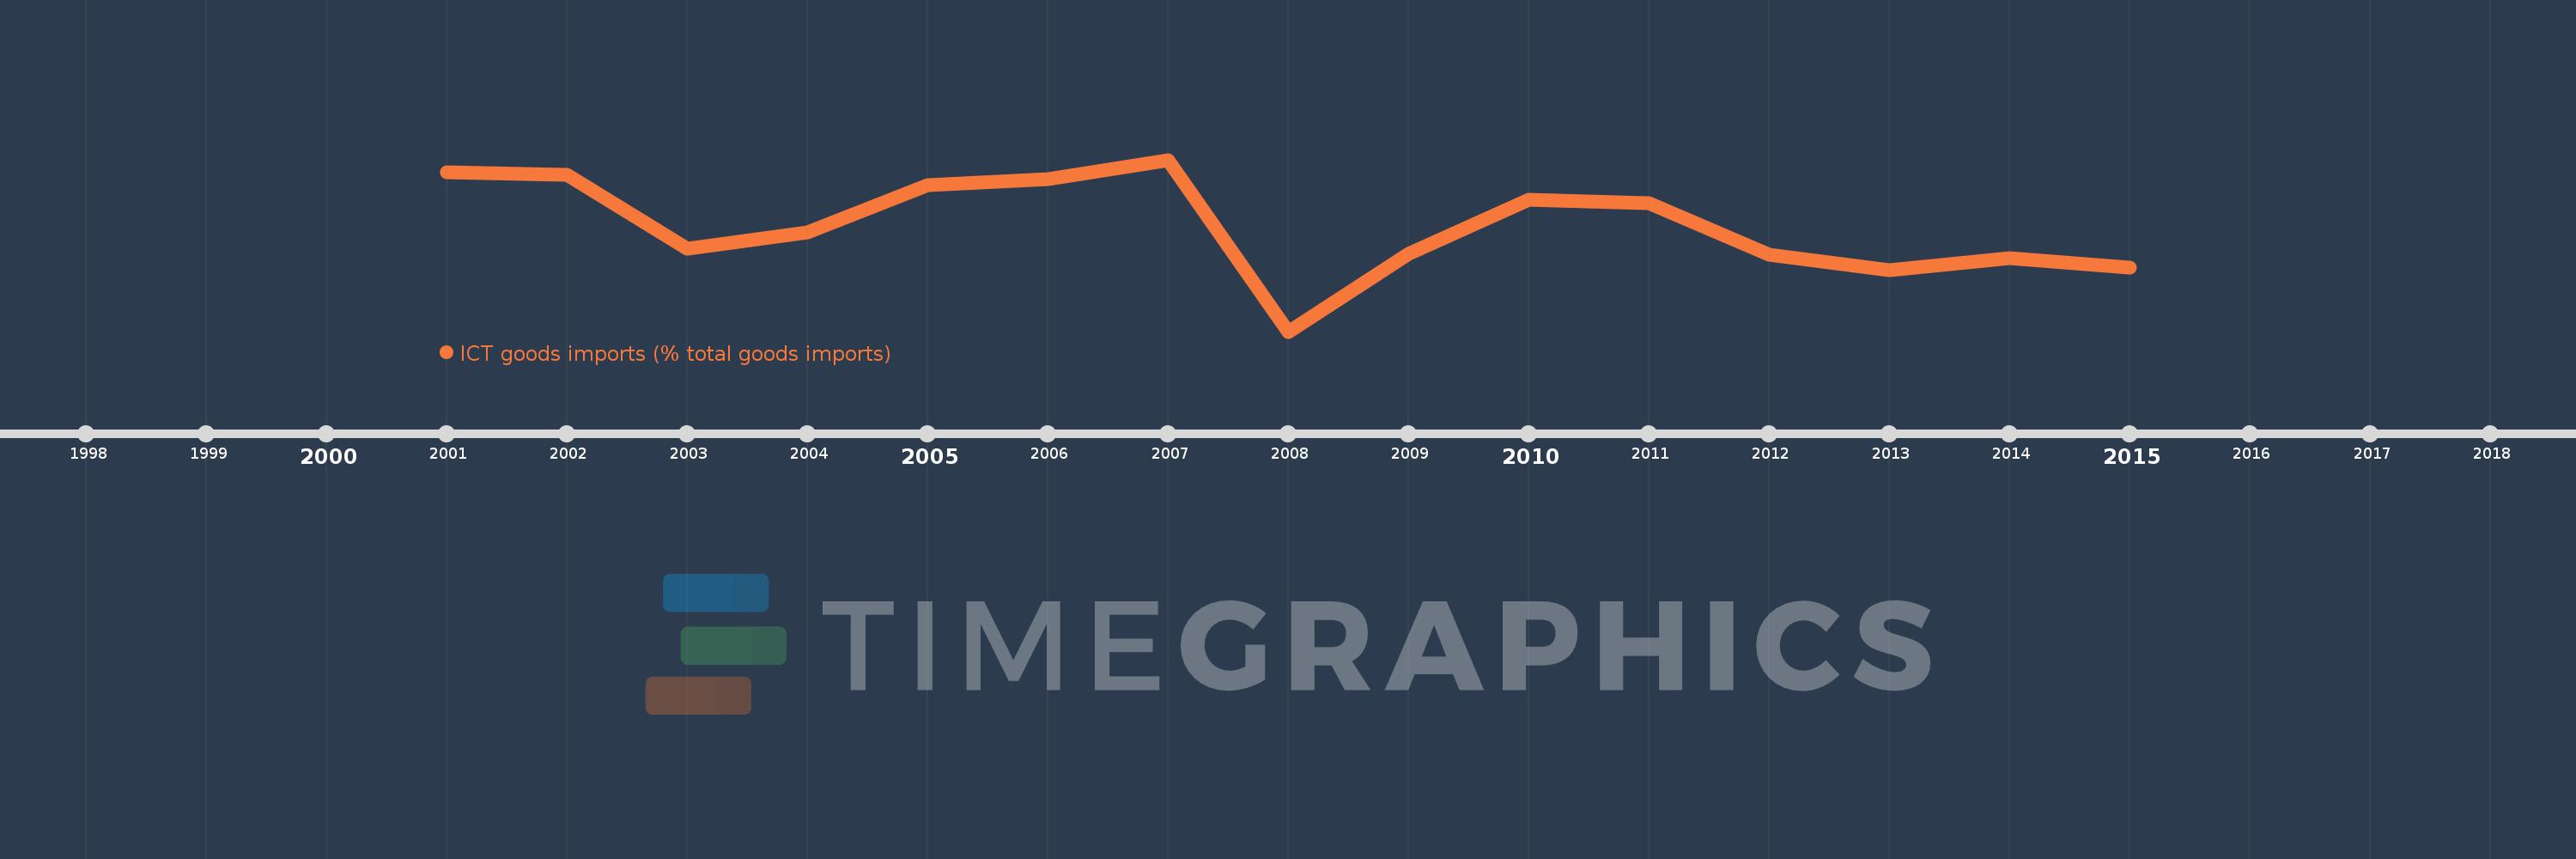
This timeline shows a graph from 2001 to 2015 of Latin America & the Caribbean (IDA & IBRD countries). No data until 2000. Number of actual observations by date: 15.
Source name:
World Development Indicators
Source organization:
United Nations Conference on Trade and Development's UNCTADstat database at http://unctadstat.unctad.org/ReportFolders/reportFolders.aspx.
Categories, topics:
Infrastructure, Private Sector, Trade
Last updated:
apr 23, 2017
Indicators value changes by year
Meaning:
11.999
Minimum:
9.734
jan 1, 2008
Maximum:
13.424
jan 1, 2007
At the date of observation
Value
Absolute change
Change from the previous value
jan 1, 2001
13.158
+13.158
0.0%
jan 1, 2002
13.1
-0.058
-0.44%
jan 1, 2003
11.513
-1.587
-12.12%
jan 1, 2004
11.869
+0.356
3.09%
jan 1, 2005
12.874
+1.005
8.47%
jan 1, 2006
13.001
+0.126
0.98%
jan 1, 2007
13.424
+0.423
3.26%
jan 1, 2008
9.734
-3.69
-27.49%
jan 1, 2009
11.396
+1.662
17.07%
jan 1, 2010
12.56
+1.164
10.22%
jan 1, 2011
12.498
-0.062
-0.5%
jan 1, 2012
11.377
-1.121
-8.97%
jan 1, 2013
11.056
-0.321
-2.82%
jan 1, 2014
11.316
+0.26
2.35%
jan 1, 2015
11.105
-0.212
-1.87%
Ranking of countries by current statistics by years