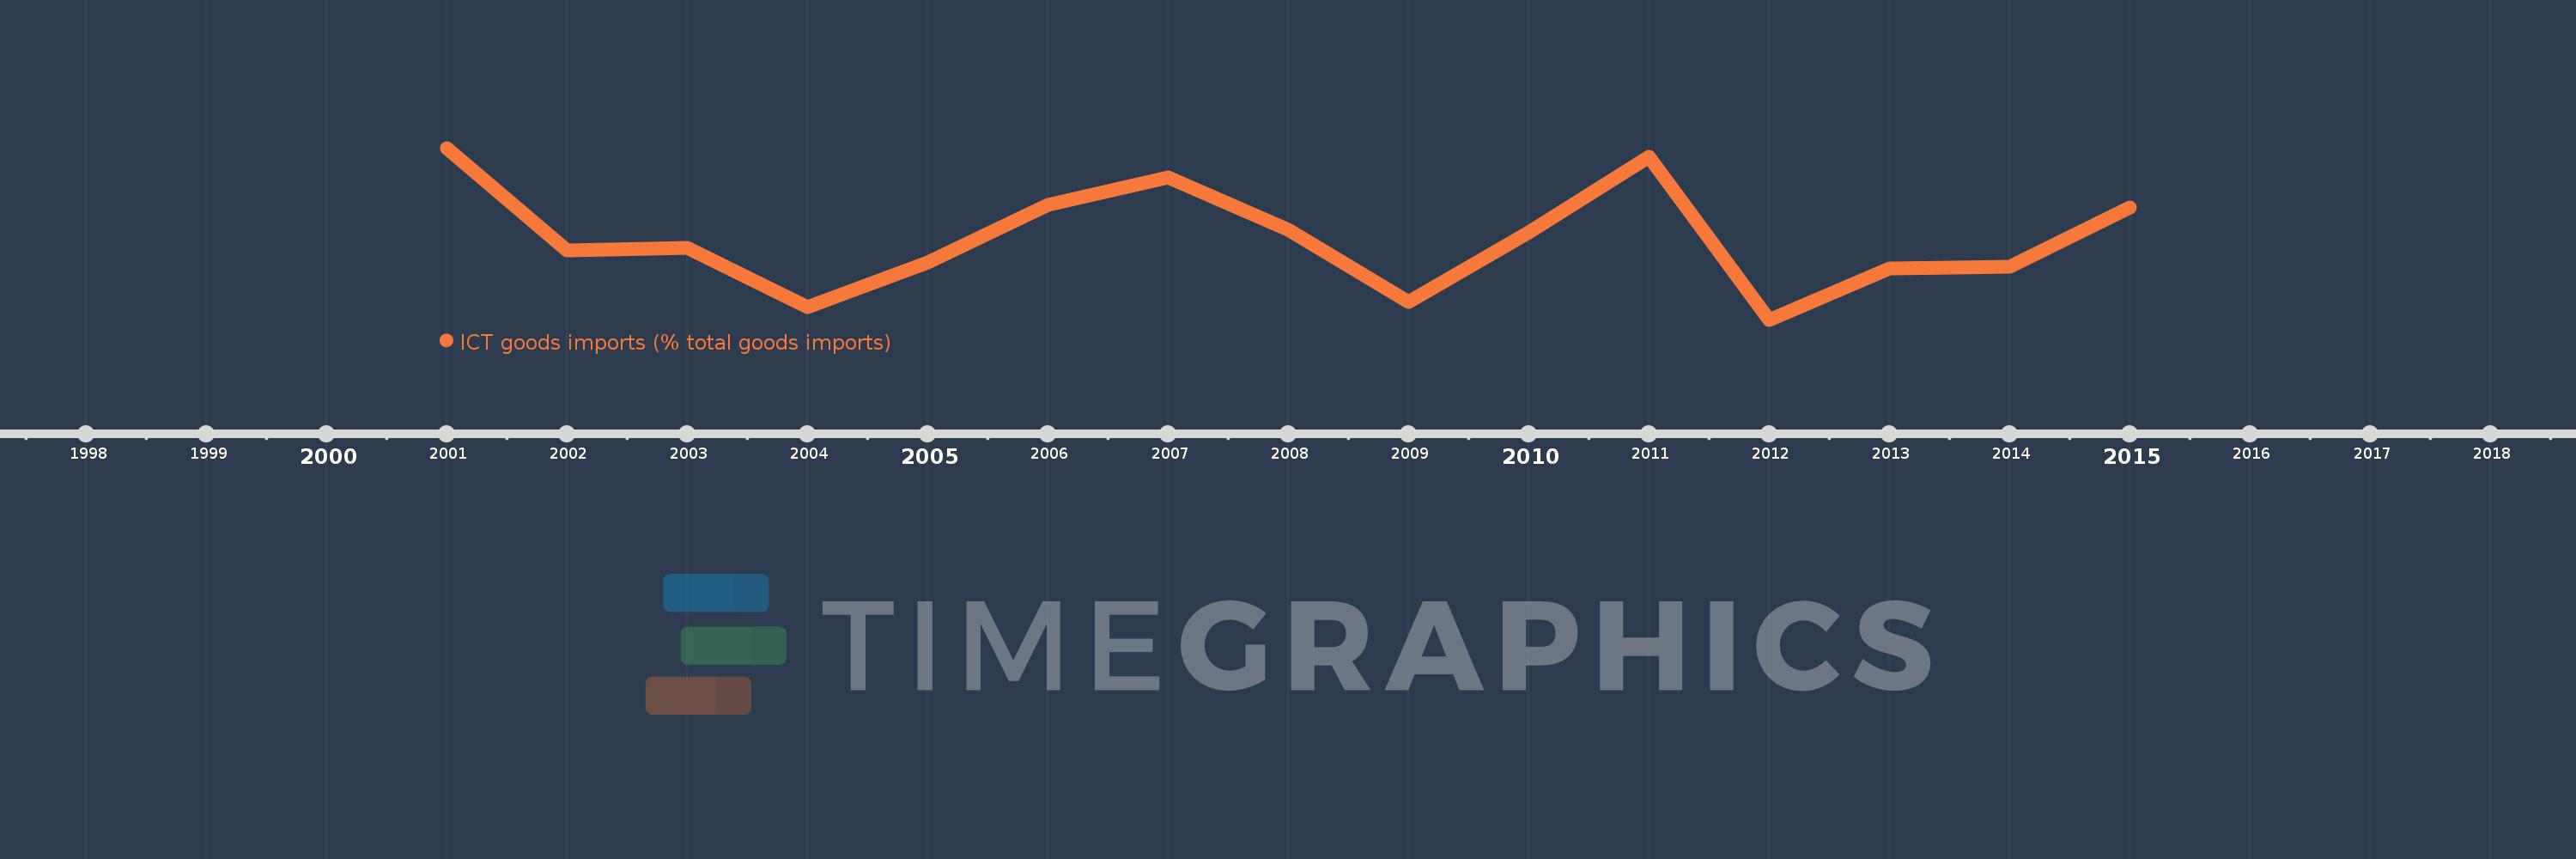
This timeline shows a graph from 2001 to 2015 of Europe & Central Asia (IDA & IBRD countries). No data until 2000. Number of actual observations by date: 15.
Source name:
World Development Indicators
Source organization:
United Nations Conference on Trade and Development's UNCTADstat database at http://unctadstat.unctad.org/ReportFolders/reportFolders.aspx.
Categories, topics:
Infrastructure, Private Sector, Trade
Last updated:
apr 23, 2017
Indicators value changes by year
Meaning:
6.245
Minimum:
5.66
jan 1, 2012
Maximum:
6.902
jan 1, 2001
At the date of observation
Value
Absolute change
Change from the previous value
jan 1, 2001
6.902
+6.902
0.0%
jan 1, 2002
6.162
-0.74
-10.72%
jan 1, 2003
6.179
+0.017
0.28%
jan 1, 2004
5.754
-0.425
-6.88%
jan 1, 2005
6.077
+0.322
5.6%
jan 1, 2006
6.488
+0.411
6.76%
jan 1, 2007
6.689
+0.201
3.11%
jan 1, 2008
6.309
-0.38
-5.68%
jan 1, 2009
5.788
-0.521
-8.26%
jan 1, 2010
6.289
+0.5
8.65%
jan 1, 2011
6.836
+0.548
8.71%
jan 1, 2012
5.66
-1.177
-17.21%
jan 1, 2013
6.029
+0.369
6.52%
jan 1, 2014
6.042
+0.013
0.22%
jan 1, 2015
6.469
+0.426
7.05%
Ranking of countries by current statistics by years