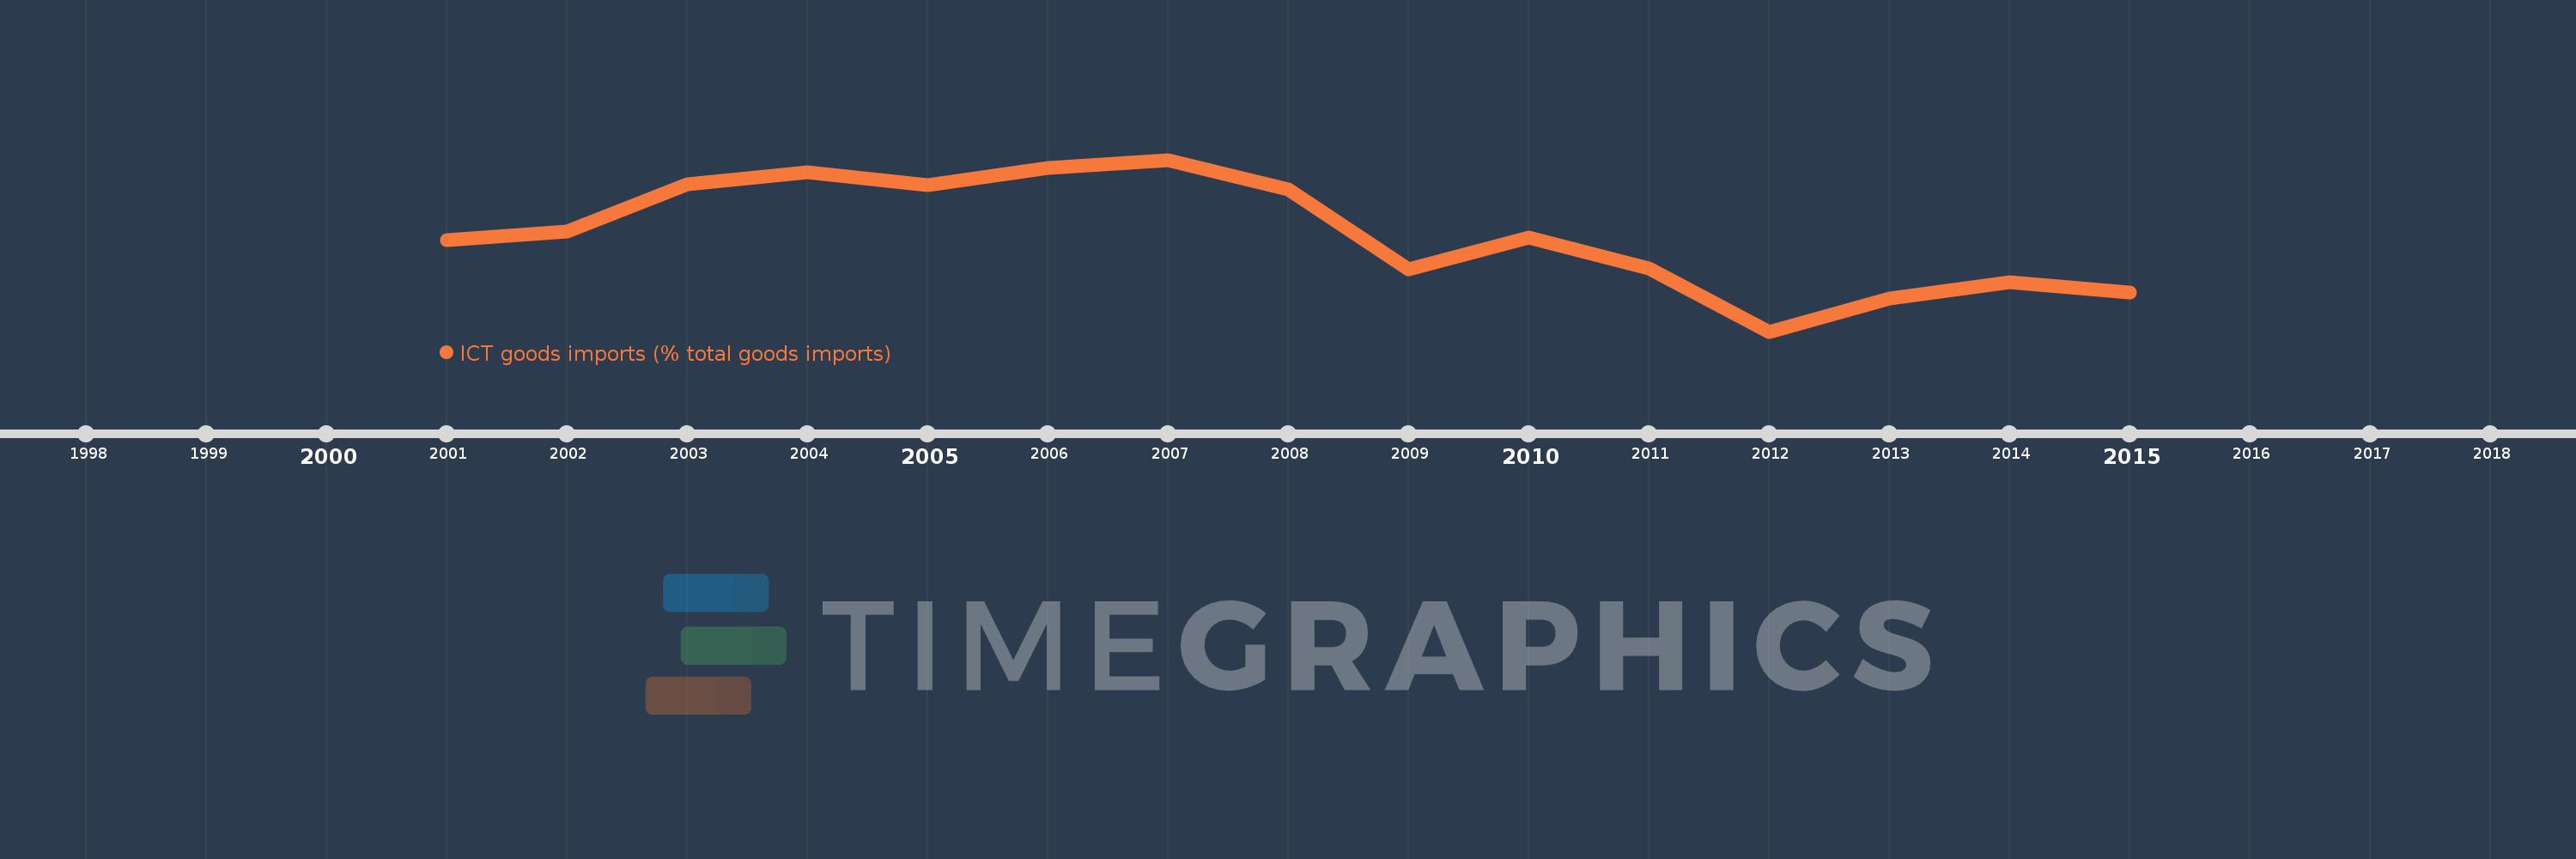
This timeline shows a graph from 2001 to 2015 of East Asia & Pacific (excluding high income). No data until 2000. Number of actual observations by date: 15.
Source name:
World Development Indicators
Source organization:
United Nations Conference on Trade and Development's UNCTADstat database at http://unctadstat.unctad.org/ReportFolders/reportFolders.aspx.
Categories, topics:
Infrastructure, Private Sector, Trade
Last updated:
apr 23, 2017
Indicators value changes by year
Meaning:
20.979
Minimum:
16.793
jan 1, 2012
Maximum:
24.165
jan 1, 2007
At the date of observation
Value
Absolute change
Change from the previous value
jan 1, 2001
20.737
+20.737
0.0%
jan 1, 2002
21.073
+0.336
1.62%
jan 1, 2003
23.108
+2.035
9.65%
jan 1, 2004
23.632
+0.525
2.27%
jan 1, 2005
23.071
-0.561
-2.37%
jan 1, 2006
23.812
+0.741
3.21%
jan 1, 2007
24.165
+0.353
1.48%
jan 1, 2008
22.88
-1.285
-5.32%
jan 1, 2009
19.48
-3.4
-14.86%
jan 1, 2010
20.832
+1.351
6.94%
jan 1, 2011
19.506
-1.326
-6.36%
jan 1, 2012
16.793
-2.713
-13.91%
jan 1, 2013
18.212
+1.42
8.45%
jan 1, 2014
18.915
+0.703
3.86%
jan 1, 2015
18.468
-0.447
-2.36%
Ranking of countries by current statistics by years