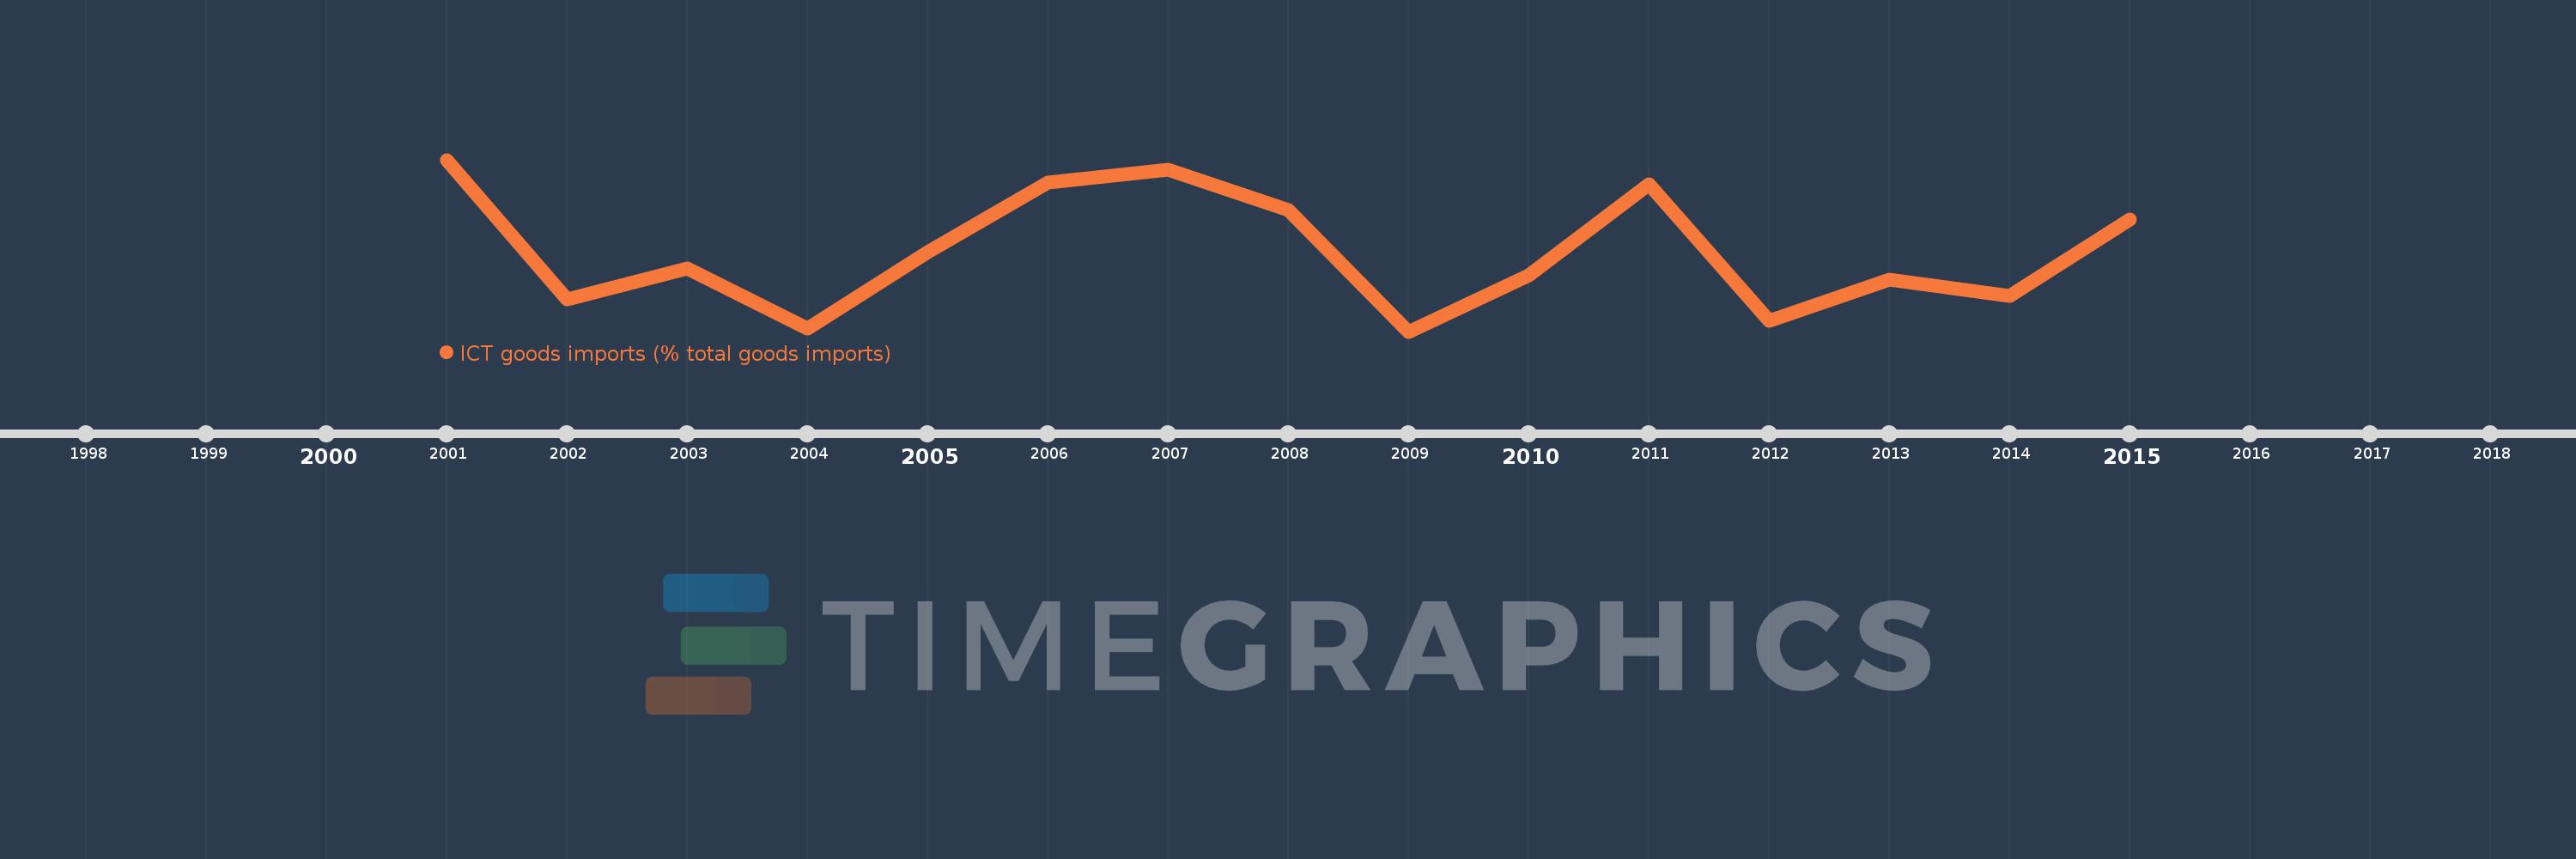
This timeline shows a graph from 2001 to 2015 of Europe & Central Asia (excluding high income). No data until 2000. Number of actual observations by date: 15.
Source name:
World Development Indicators
Source organization:
United Nations Conference on Trade and Development's UNCTADstat database at http://unctadstat.unctad.org/ReportFolders/reportFolders.aspx.
Categories, topics:
Infrastructure, Private Sector, Trade
Last updated:
apr 23, 2017
Indicators value changes by year
Meaning:
5.707
Minimum:
5.213
jan 1, 2009
Maximum:
6.278
jan 1, 2001
At the date of observation
Value
Absolute change
Change from the previous value
jan 1, 2001
6.278
+6.278
0.0%
jan 1, 2002
5.411
-0.867
-13.81%
jan 1, 2003
5.604
+0.194
3.58%
jan 1, 2004
5.232
-0.372
-6.64%
jan 1, 2005
5.705
+0.472
9.03%
jan 1, 2006
6.139
+0.434
7.61%
jan 1, 2007
6.217
+0.078
1.27%
jan 1, 2008
5.968
-0.249
-4.01%
jan 1, 2009
5.213
-0.755
-12.64%
jan 1, 2010
5.562
+0.348
6.68%
jan 1, 2011
6.128
+0.566
10.17%
jan 1, 2012
5.281
-0.847
-13.82%
jan 1, 2013
5.533
+0.252
4.77%
jan 1, 2014
5.434
-0.099
-1.79%
jan 1, 2015
5.907
+0.473
8.7%
Ranking of countries by current statistics by years