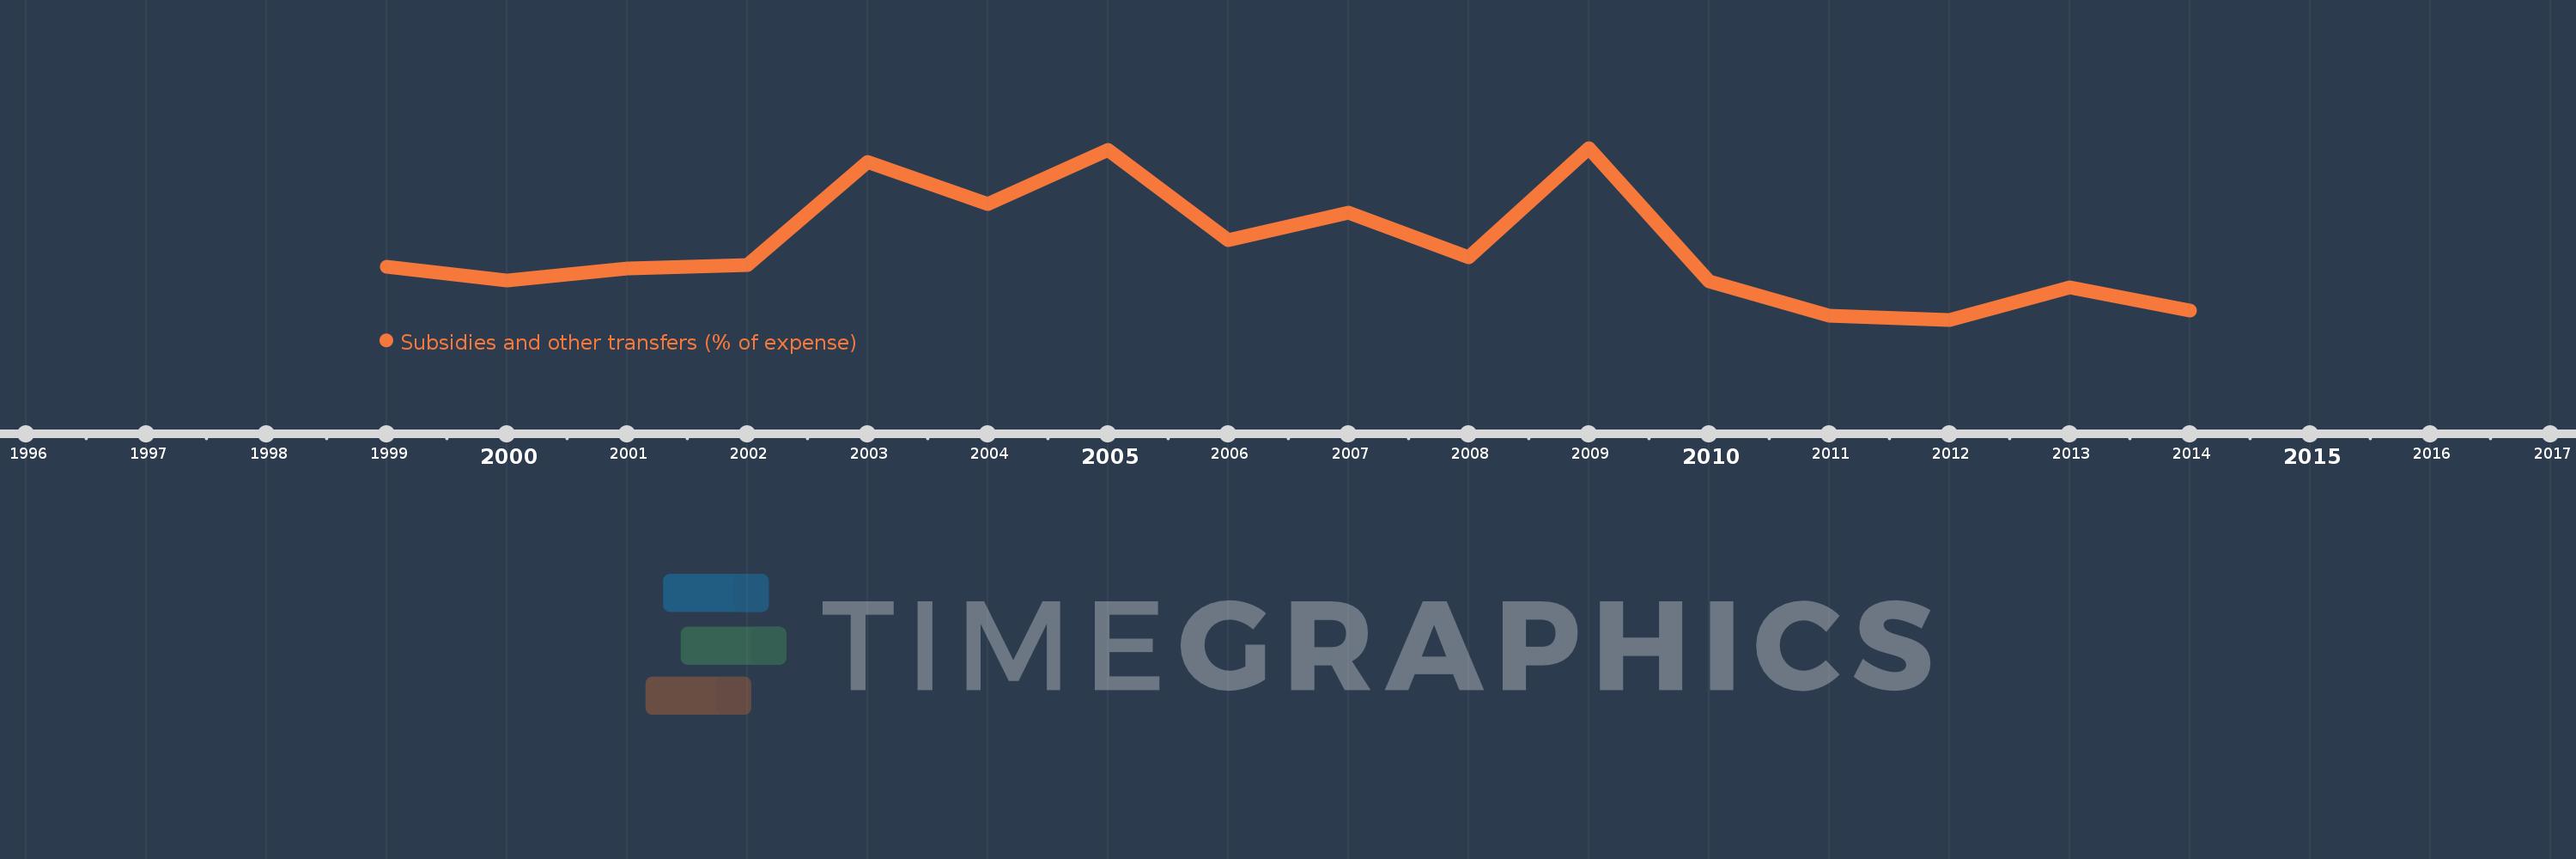
This timeline shows a graph from 1999 to 2014 of Latin America & Caribbean (excluding high income). No data until 1998. Number of actual observations by date: 16.
Source name:
World Development Indicators
Source organization:
International Monetary Fund, Government Finance Statistics Yearbook and data files.
Categories, topics:
Public Sector
Last updated:
apr 23, 2017
Indicators value changes by year
Meaning:
30.047
Minimum:
26.016
jan 1, 2012
Maximum:
35.68
jan 1, 2009
At the date of observation
Value
Absolute change
Change from the previous value
jan 1, 1999
29.014
+29.014
0.0%
jan 1, 2000
28.235
-0.779
-2.68%
jan 1, 2001
28.894
+0.659
2.33%
jan 1, 2002
29.104
+0.21
0.73%
jan 1, 2003
34.905
+5.801
19.93%
jan 1, 2004
32.524
-2.381
-6.82%
jan 1, 2005
35.582
+3.058
9.4%
jan 1, 2006
30.492
-5.09
-14.31%
jan 1, 2007
32.032
+1.54
5.05%
jan 1, 2008
29.534
-2.498
-7.8%
jan 1, 2009
35.68
+6.146
20.81%
jan 1, 2010
28.156
-7.523
-21.09%
jan 1, 2011
26.23
-1.927
-6.84%
jan 1, 2012
26.016
-0.214
-0.82%
jan 1, 2013
27.843
+1.827
7.02%
jan 1, 2014
26.513
-1.33
-4.78%
Ranking of countries by current statistics by years