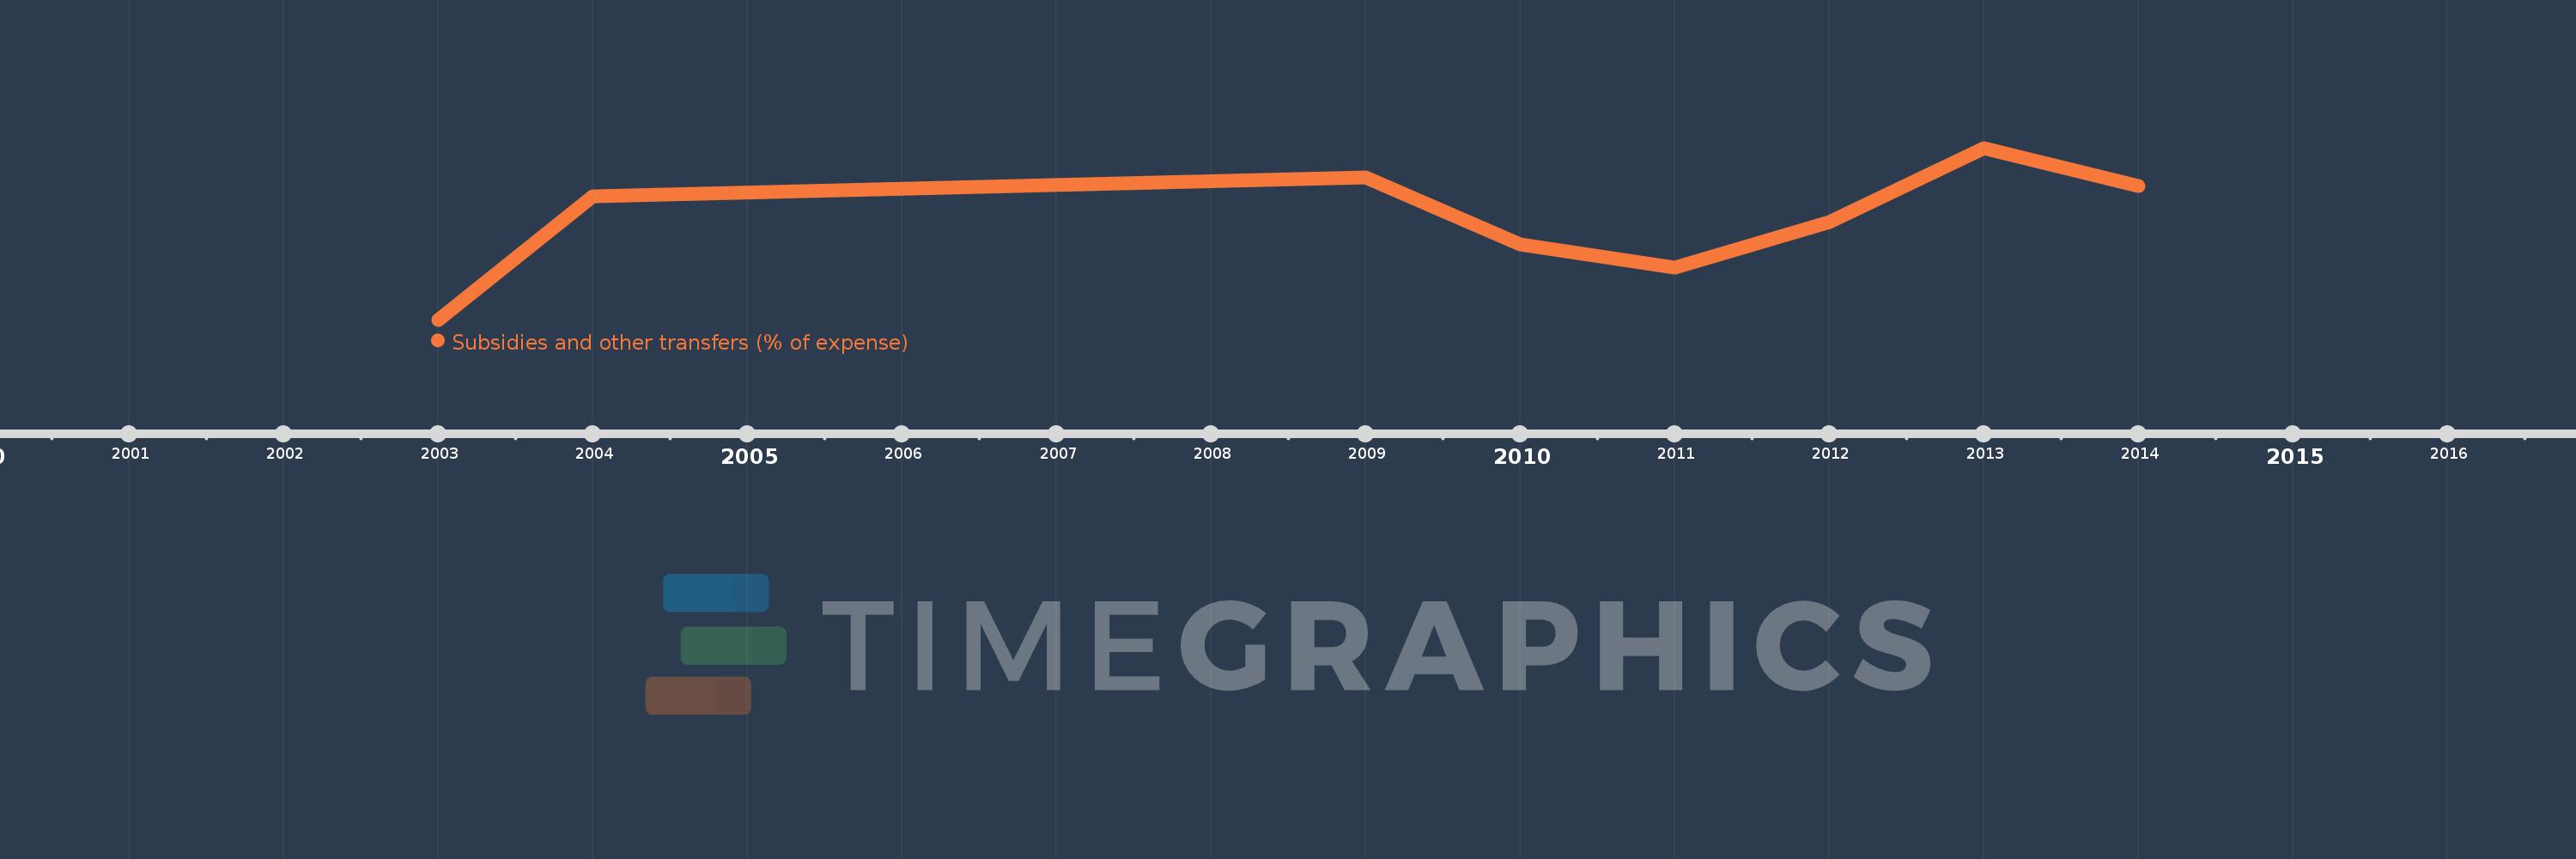
This timeline shows a graph from 2003 to 2014 of East Asia & Pacific (excluding high income). No data until 2002. Number of actual observations by date: 8.
Source name:
World Development Indicators
Source organization:
International Monetary Fund, Government Finance Statistics Yearbook and data files.
Categories, topics:
Public Sector
Last updated:
apr 23, 2017
Indicators value changes by year
Meaning:
26.174
Minimum:
20.962
jan 1, 2003
Maximum:
29.957
jan 1, 2013
At the date of observation
Value
Absolute change
Change from the previous value
jan 1, 2003
20.962
+20.962
0.0%
jan 1, 2004
27.425
+6.463
30.83%
jan 1, 2009
28.408
+0.983
3.58%
jan 1, 2010
24.91
-3.498
-12.31%
jan 1, 2011
23.687
-1.223
-4.91%
jan 1, 2012
26.09
+2.403
10.14%
jan 1, 2013
29.957
+3.867
14.82%
jan 1, 2014
27.955
-2.002
-6.68%
Ranking of countries by current statistics by years