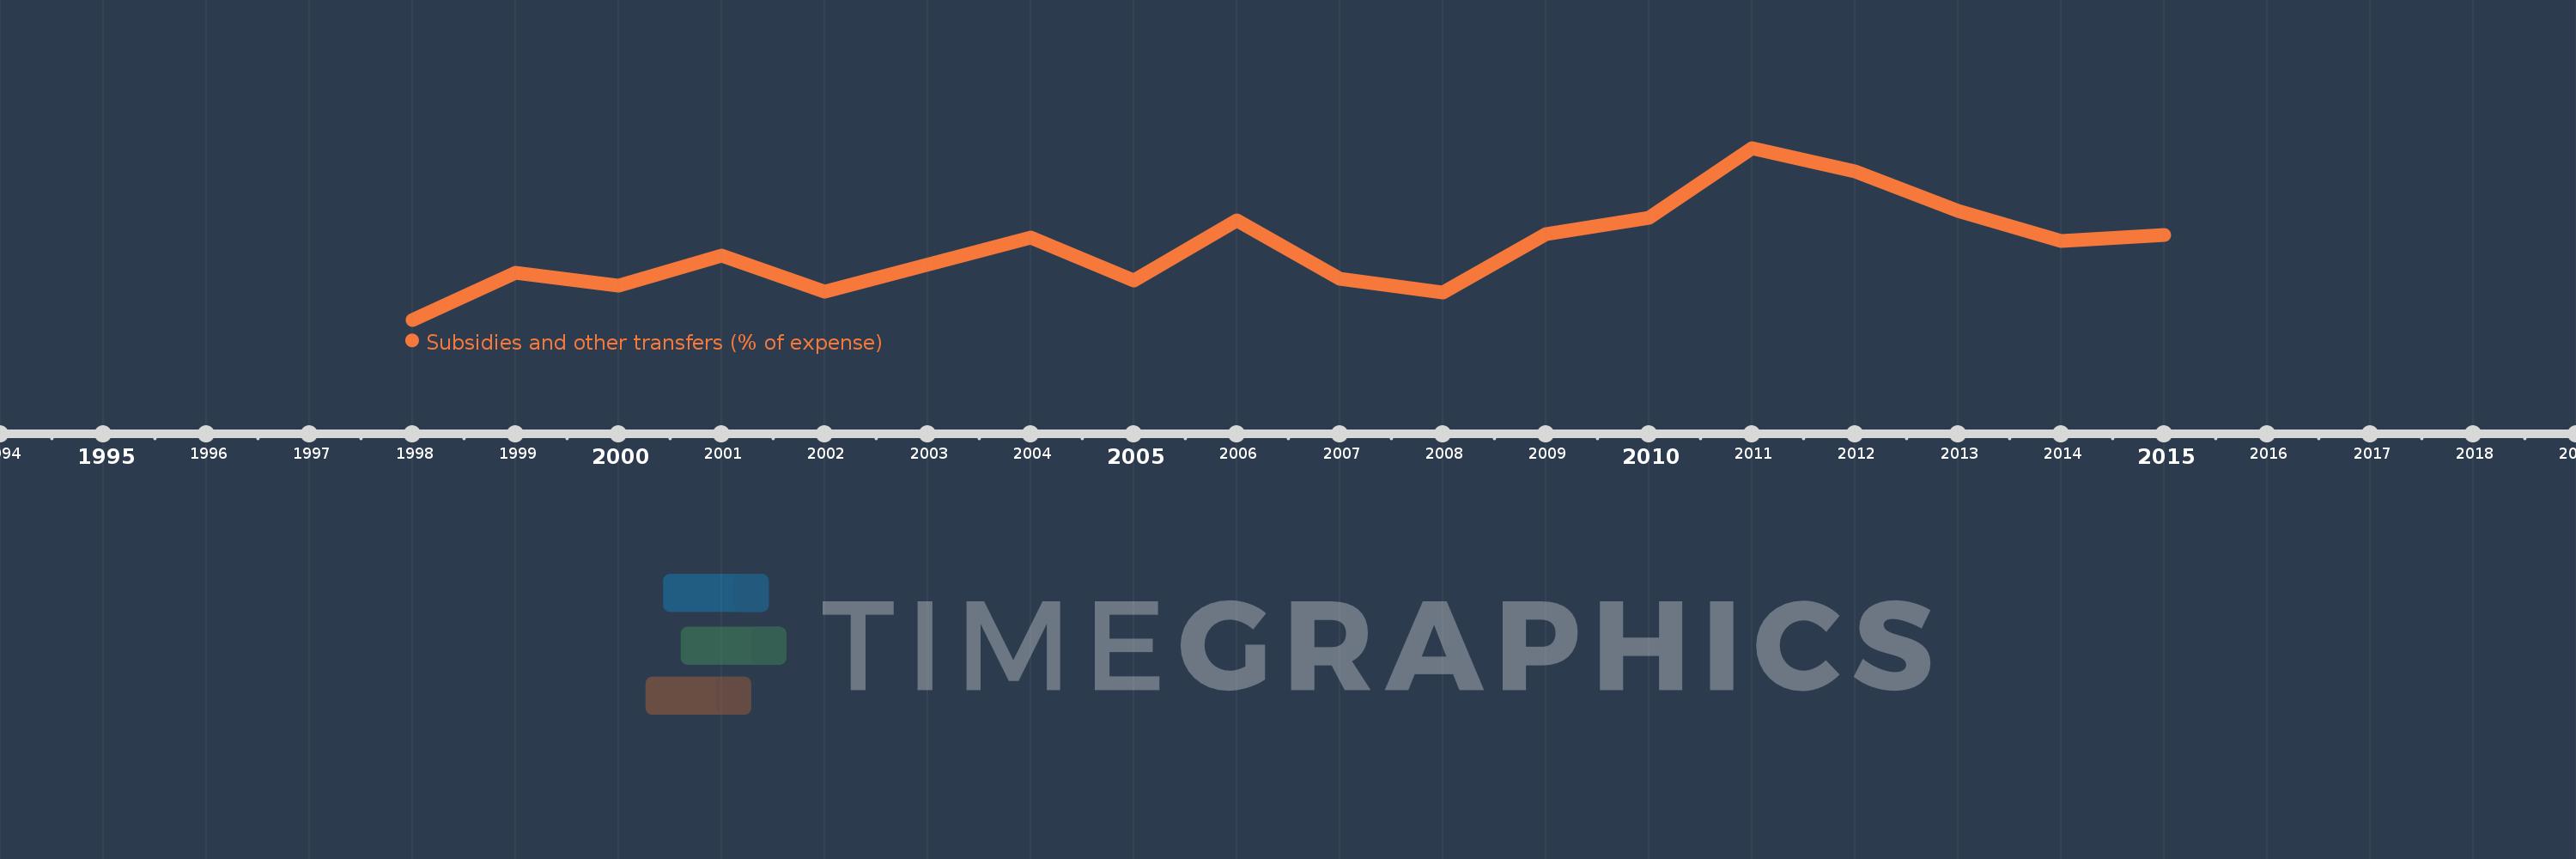
This timeline shows a graph from 1998 to 2015 of Europe & Central Asia (excluding high income). No data until 1997. Number of actual observations by date: 17.
Source name:
World Development Indicators
Source organization:
International Monetary Fund, Government Finance Statistics Yearbook and data files.
Categories, topics:
Public Sector
Last updated:
apr 23, 2017
Indicators value changes by year
Meaning:
51.17
Minimum:
46.03
jan 1, 1998
Maximum:
58.106
jan 1, 2011
At the date of observation
Value
Absolute change
Change from the previous value
jan 1, 1998
46.03
+46.03
0.0%
jan 1, 1999
49.337
+3.307
7.18%
jan 1, 2000
48.398
-0.939
-1.9%
jan 1, 2001
50.533
+2.135
4.41%
jan 1, 2002
48.014
-2.519
-4.98%
jan 1, 2004
51.807
+3.793
7.9%
jan 1, 2005
48.788
-3.019
-5.83%
jan 1, 2006
52.998
+4.21
8.63%
jan 1, 2007
48.913
-4.086
-7.71%
jan 1, 2008
47.97
-0.942
-1.93%
jan 1, 2009
52.04
+4.07
8.48%
jan 1, 2010
53.217
+1.177
2.26%
jan 1, 2011
58.106
+4.889
9.19%
jan 1, 2012
56.482
-1.624
-2.8%
jan 1, 2013
53.688
-2.794
-4.95%
jan 1, 2014
51.549
-2.14
-3.99%
jan 1, 2015
52.009
+0.46
0.89%
Ranking of countries by current statistics by years