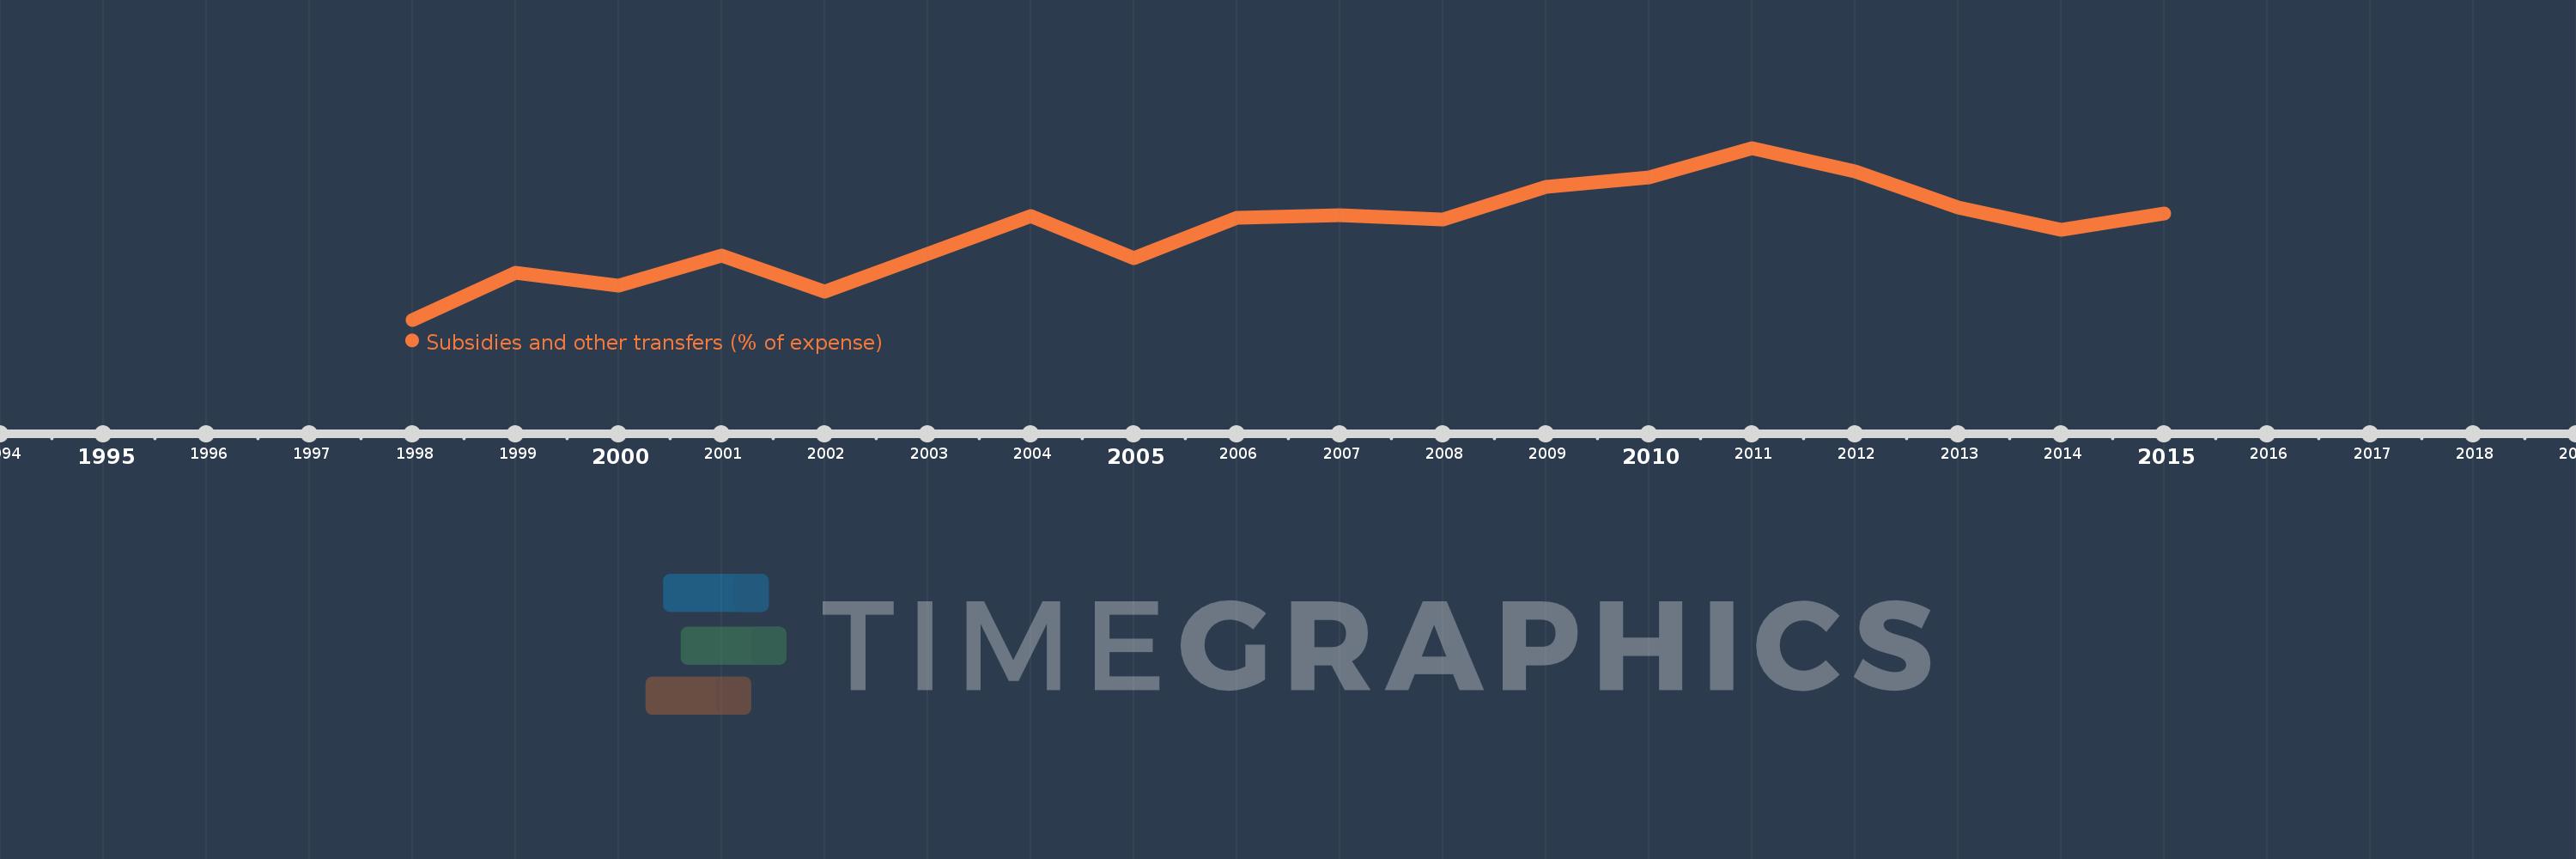
This timeline shows a graph from 1998 to 2015 of Europe & Central Asia (IDA & IBRD countries). No data until 1997. Number of actual observations by date: 17.
Source name:
World Development Indicators
Source organization:
International Monetary Fund, Government Finance Statistics Yearbook and data files.
Categories, topics:
Public Sector
Last updated:
apr 23, 2017
Indicators value changes by year
Meaning:
52.437
Minimum:
46.03
jan 1, 1998
Maximum:
58.106
jan 1, 2011
At the date of observation
Value
Absolute change
Change from the previous value
jan 1, 1998
46.03
+46.03
0.0%
jan 1, 1999
49.337
+3.307
7.18%
jan 1, 2000
48.398
-0.939
-1.9%
jan 1, 2001
50.533
+2.135
4.41%
jan 1, 2002
48.014
-2.519
-4.98%
jan 1, 2004
53.322
+5.308
11.05%
jan 1, 2005
50.37
-2.952
-5.54%
jan 1, 2006
53.186
+2.816
5.59%
jan 1, 2007
53.384
+0.198
0.37%
jan 1, 2008
53.09
-0.294
-0.55%
jan 1, 2009
55.357
+2.267
4.27%
jan 1, 2010
56.028
+0.671
1.21%
jan 1, 2011
58.106
+2.079
3.71%
jan 1, 2012
56.482
-1.624
-2.8%
jan 1, 2013
53.948
-2.535
-4.49%
jan 1, 2014
52.338
-1.609
-2.98%
jan 1, 2015
53.5
+1.162
2.22%
Ranking of countries by current statistics by years