33
/
AIzaSyB4mHJ5NPEv-XzF7P6NDYXjlkCWaeKw5bc
November 30, 2025
287573
Zimbabwe
ZWE
true
2
1
Net financial flows, IMF concessional (NFL, current US$)
2016,2015,2014,2013,2011,2010,2009,2008,2007,2005,2004,2003,2002,2001,2000,1999,1996,1995,1994,1993
Create a timeline
Public Timelines
For education
For educational institutions
For teachers
For students
Cabinet
For educational institutions
For teachers
For students
Open cabinet
FAQ
Close
Create a timeline
Public timelines
FAQ
About & Feedback
Terms
Privacy
FAQ
Support 24/7
Cabinet
Get premium
Donate
Download
Global statistics library
→
Zimbabwe
→
Net financial flows, IMF concessional (NFL, current US$)
This statistics in other country:
Afghanistan
Albania
Armenia
Azerbaijan
Bangladesh
Benin
Bolivia
Burkina Faso
Burundi
Cabo Verde
Cambodia
Cameroon
Central African Republic
Chad
Chile
China
Comoros
Congo, Dem. Rep.
Congo, Rep.
Cote d'Ivoire
Djibouti
Dominica
East Asia & Pacific (excluding high income)
Egypt, Arab Rep.
Ethiopia
Europe & Central Asia (excluding high income)
Gambia, The
Georgia
Ghana
Grenada
Guinea
Guinea-Bissau
Guyana
Haiti
Honduras
Hungary
IDA only
India
Kenya
Kyrgyz Republic
Lao PDR
Latin America & Caribbean (excluding high income)
Latvia
Lesotho
Liberia
Lithuania
Low & middle income
Low income
Lower middle income
Macedonia, FYR
Madagascar
Malawi
Maldives
Mali
Mauritania
Mauritius
Middle East & North Africa (excluding high income)
Middle income
Moldova
Mongolia
Morocco
Mozambique
Nepal
Nicaragua
Niger
Pakistan
Papua New Guinea
Philippines
Rwanda
Samoa
Sao Tome and Principe
Senegal
Seychelles
Sierra Leone
Solomon Islands
Somalia
South Asia
Sri Lanka
St. Lucia
St. Vincent and the Grenadines
Sub-Saharan Africa (excluding high income)
Sudan
Swaziland
Syrian Arab Republic
Tajikistan
Tanzania
Thailand
Togo
Tunisia
Uganda
Upper middle income
Uruguay
Vanuatu
Vietnam
Yemen, Rep.
Zambia
Zimbabwe
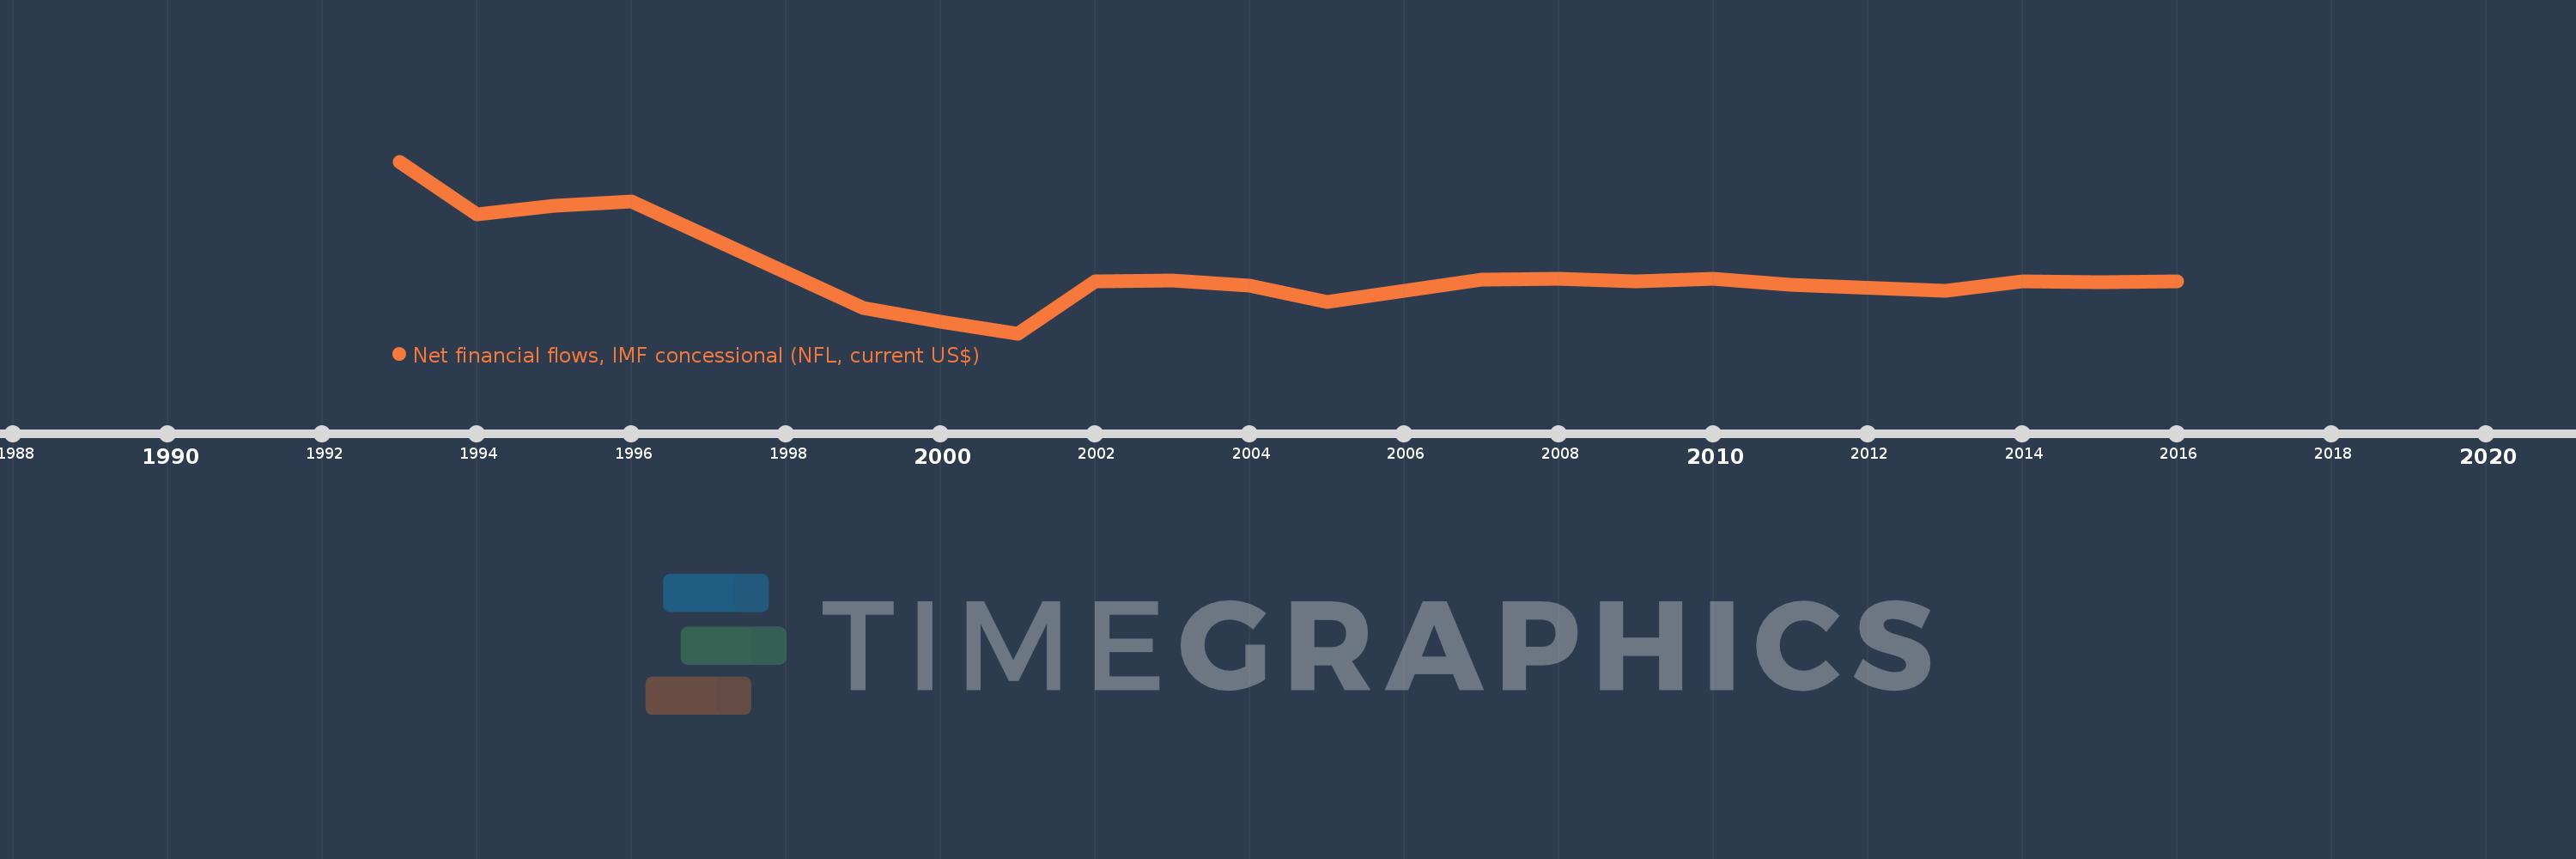
Timeline:
This timeline shows a graph from
1993
to
2016
of Zimbabwe. No data until
1992
. Number of actual observations by date:
20
.
Source name:
World Development Indicators
Source organization:
World Bank, International Debt Statistics.
Categories, topics:
External Debt
Last updated:
apr 23, 2017
Indicators value changes by year
Meaning:
4.709 mln
Minimum:
-35.666 mln
jan 1, 2001
Maximum:
77.051 mln
jan 1, 1993
At the date of observation
Value
Absolute change
Change from the previous value
jan 1, 1993
77.051 mln
+77.051 mln
0.0%
jan 1, 1994
42.45 mln
-34.601 mln
-44.91%
jan 1, 1995
47.831 mln
+5.381 mln
12.68%
jan 1, 1996
50.676 mln
+2.845 mln
5.95%
jan 1, 1999
-18.968 mln
-69.644 mln
-137.43%
jan 1, 2000
-27.84 mln
-8.872 mln
46.77%
jan 1, 2001
-35.666 mln
-7.826 mln
28.11%
jan 1, 2002
-1.319 mln
+34.347 mln
-96.3%
jan 1, 2003
-1.103 mln
+216.0K
-16.38%
jan 1, 2004
-4.48 mln
-3.377 mln
306.17%
jan 1, 2005
-15.108 mln
-10.628 mln
237.23%
jan 1, 2007
-396.0K
+14.712 mln
-97.38%
jan 1, 2008
-118.0K
+278.0K
-70.2%
jan 1, 2009
-1.676 mln
-1.558 mln
1.32K%
jan 1, 2010
-113.0K
+1.563 mln
-93.26%
jan 1, 2011
-3.983 mln
-3.87 mln
3.42K%
jan 1, 2013
-7.491 mln
-3.508 mln
88.07%
jan 1, 2014
-1.808 mln
+5.683 mln
-75.86%
jan 1, 2015
-1.951 mln
-143.0K
7.91%
jan 1, 2016
-1.802 mln
+149.0K
-7.64%
Ranking of countries by current statistics by years
About & Feedback
Terms
Privacy
FAQ
Support 24/7
Cabinet
Get premium
Donate
The service accepts bank transfer (ACH, Wire) or cards (Visa, MasterCard, etc). Processed by Stripe.
Secured with SSL