33
/
AIzaSyB4mHJ5NPEv-XzF7P6NDYXjlkCWaeKw5bc
November 30, 2025
210745
Nicaragua
NIC
true
2
1
Net financial flows, IMF concessional (NFL, current US$)
2016,2015,2014,2013,2012,2011,2010,2009,2008,2007,2006,2005,2004,2003,2002,2001,2000,1999,1995
Create a timeline
Public Timelines
For education
For educational institutions
For teachers
For students
Cabinet
For educational institutions
For teachers
For students
Open cabinet
FAQ
Close
Create a timeline
Public timelines
FAQ
About & Feedback
Terms
Privacy
FAQ
Support 24/7
Cabinet
Get premium
Donate
Download
Global statistics library
→
Nicaragua
→
Net financial flows, IMF concessional (NFL, current US$)
This statistics in other country:
Afghanistan
Albania
Armenia
Azerbaijan
Bangladesh
Benin
Bolivia
Burkina Faso
Burundi
Cabo Verde
Cambodia
Cameroon
Central African Republic
Chad
Chile
China
Comoros
Congo, Dem. Rep.
Congo, Rep.
Cote d'Ivoire
Djibouti
Dominica
East Asia & Pacific (excluding high income)
Egypt, Arab Rep.
Ethiopia
Europe & Central Asia (excluding high income)
Gambia, The
Georgia
Ghana
Grenada
Guinea
Guinea-Bissau
Guyana
Haiti
Honduras
Hungary
IDA only
India
Kenya
Kyrgyz Republic
Lao PDR
Latin America & Caribbean (excluding high income)
Latvia
Lesotho
Liberia
Lithuania
Low & middle income
Low income
Lower middle income
Macedonia, FYR
Madagascar
Malawi
Maldives
Mali
Mauritania
Mauritius
Middle East & North Africa (excluding high income)
Middle income
Moldova
Mongolia
Morocco
Mozambique
Nepal
Nicaragua
Niger
Pakistan
Papua New Guinea
Philippines
Rwanda
Samoa
Sao Tome and Principe
Senegal
Seychelles
Sierra Leone
Solomon Islands
Somalia
South Asia
Sri Lanka
St. Lucia
St. Vincent and the Grenadines
Sub-Saharan Africa (excluding high income)
Sudan
Swaziland
Syrian Arab Republic
Tajikistan
Tanzania
Thailand
Togo
Tunisia
Uganda
Upper middle income
Uruguay
Vanuatu
Vietnam
Yemen, Rep.
Zambia
Zimbabwe
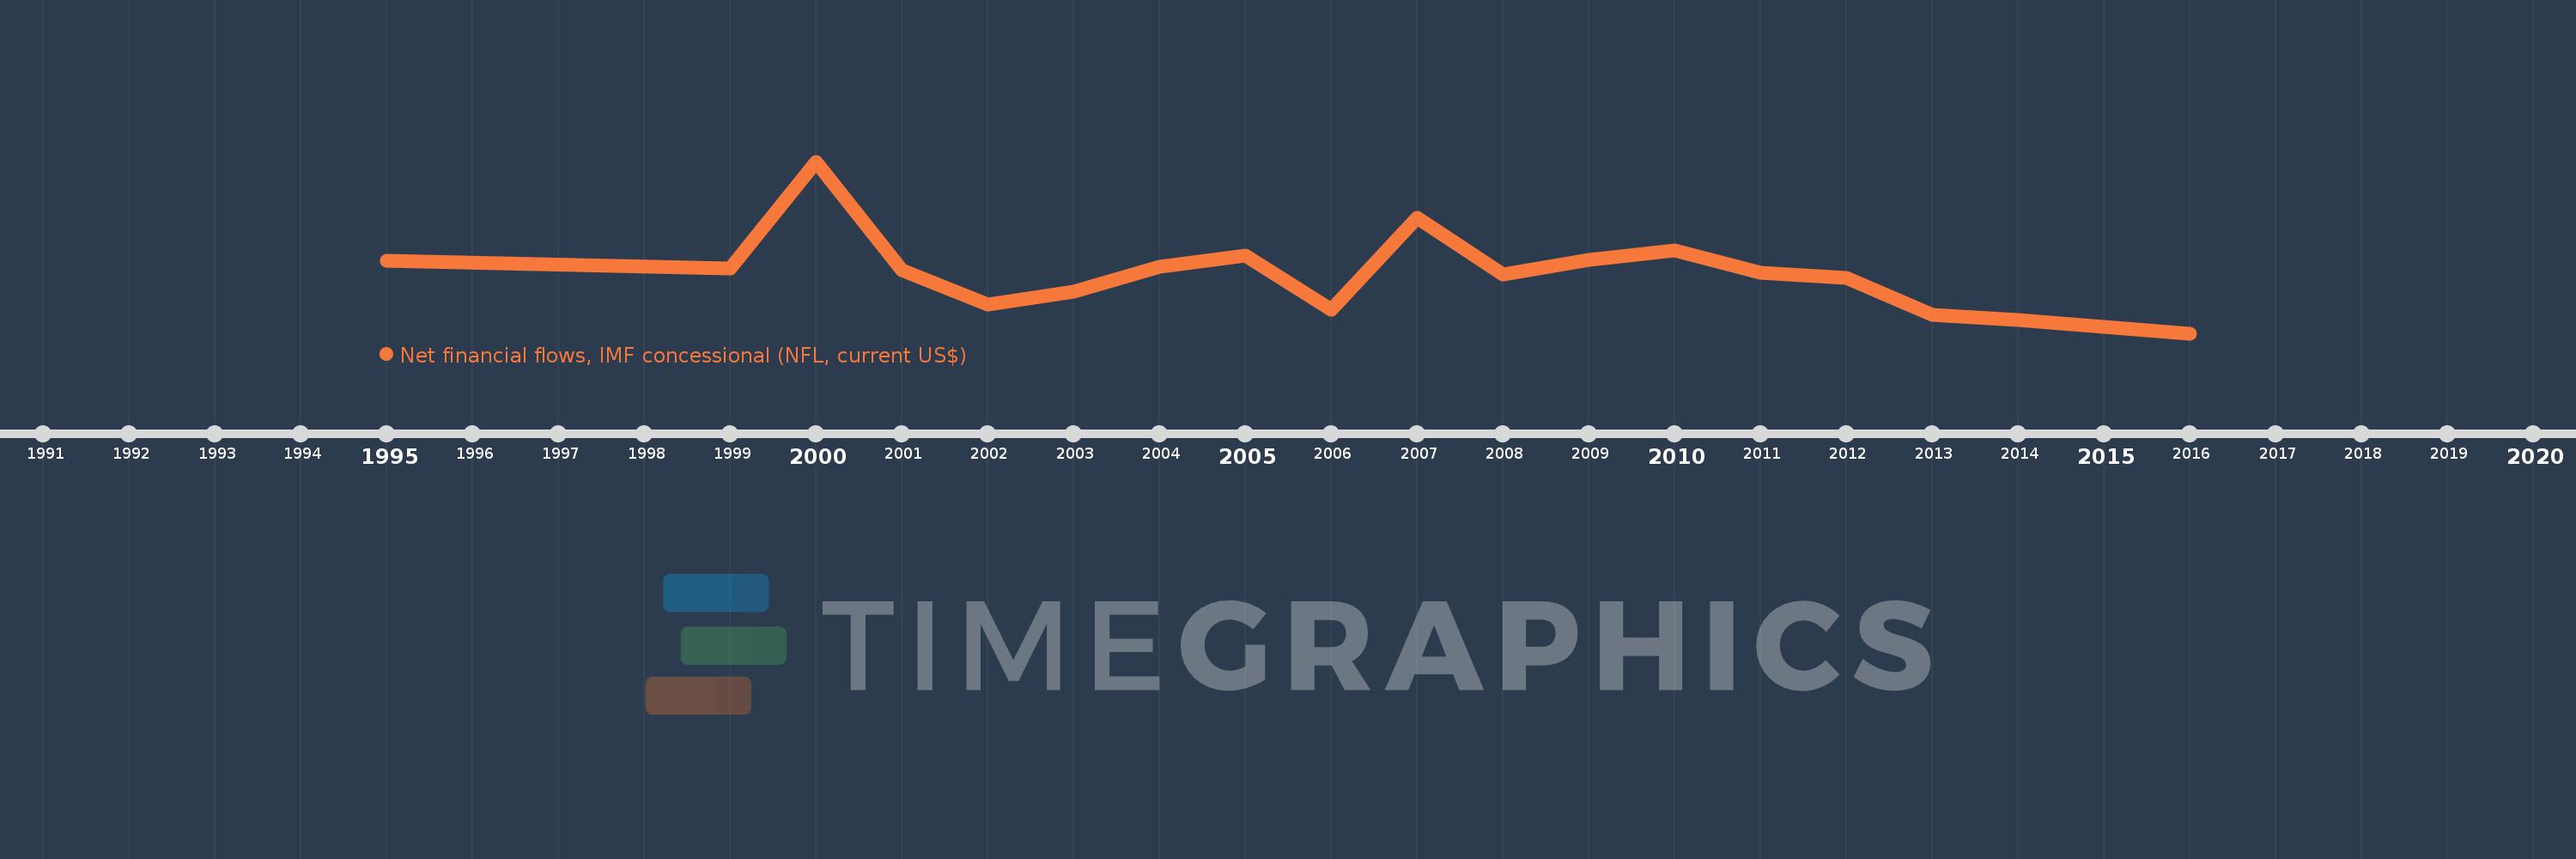
Timeline:
This timeline shows a graph from
1995
to
2016
of Nicaragua. No data until
1994
. Number of actual observations by date:
19
.
Source name:
World Development Indicators
Source organization:
World Bank, International Debt Statistics.
Categories, topics:
External Debt
Last updated:
apr 23, 2017
Indicators value changes by year
Meaning:
17.21 mln
Minimum:
-26.83 mln
jan 1, 2016
Maximum:
104.353 mln
jan 1, 2000
At the date of observation
Value
Absolute change
Change from the previous value
jan 1, 1995
28.67 mln
+28.67 mln
0.0%
jan 1, 1999
22.818 mln
-5.852 mln
-20.41%
jan 1, 2000
104.353 mln
+81.535 mln
357.33%
jan 1, 2001
21.343 mln
-83.01 mln
-79.55%
jan 1, 2002
-5.097 mln
-26.44 mln
-123.88%
jan 1, 2003
4.695 mln
+9.792 mln
-192.11%
jan 1, 2004
23.917 mln
+19.222 mln
409.41%
jan 1, 2005
32.692 mln
+8.775 mln
36.69%
jan 1, 2006
-8.854 mln
-41.546 mln
-127.08%
jan 1, 2007
61.475 mln
+70.329 mln
-794.32%
jan 1, 2008
18.218 mln
-43.257 mln
-70.37%
jan 1, 2009
29.086 mln
+10.868 mln
59.66%
jan 1, 2010
36.711 mln
+7.625 mln
26.22%
jan 1, 2011
19.532 mln
-17.179 mln
-46.8%
jan 1, 2012
15.306 mln
-4.226 mln
-21.64%
jan 1, 2013
-12.764 mln
-28.07 mln
-183.39%
jan 1, 2014
-16.378 mln
-3.614 mln
28.31%
jan 1, 2015
-21.903 mln
-5.525 mln
33.73%
jan 1, 2016
-26.83 mln
-4.927 mln
22.49%
Ranking of countries by current statistics by years
About & Feedback
Terms
Privacy
FAQ
Support 24/7
Cabinet
Get premium
Donate
The service accepts bank transfer (ACH, Wire) or cards (Visa, MasterCard, etc). Processed by Stripe.
Secured with SSL