33
/
AIzaSyB4mHJ5NPEv-XzF7P6NDYXjlkCWaeKw5bc
November 30, 2025
179203
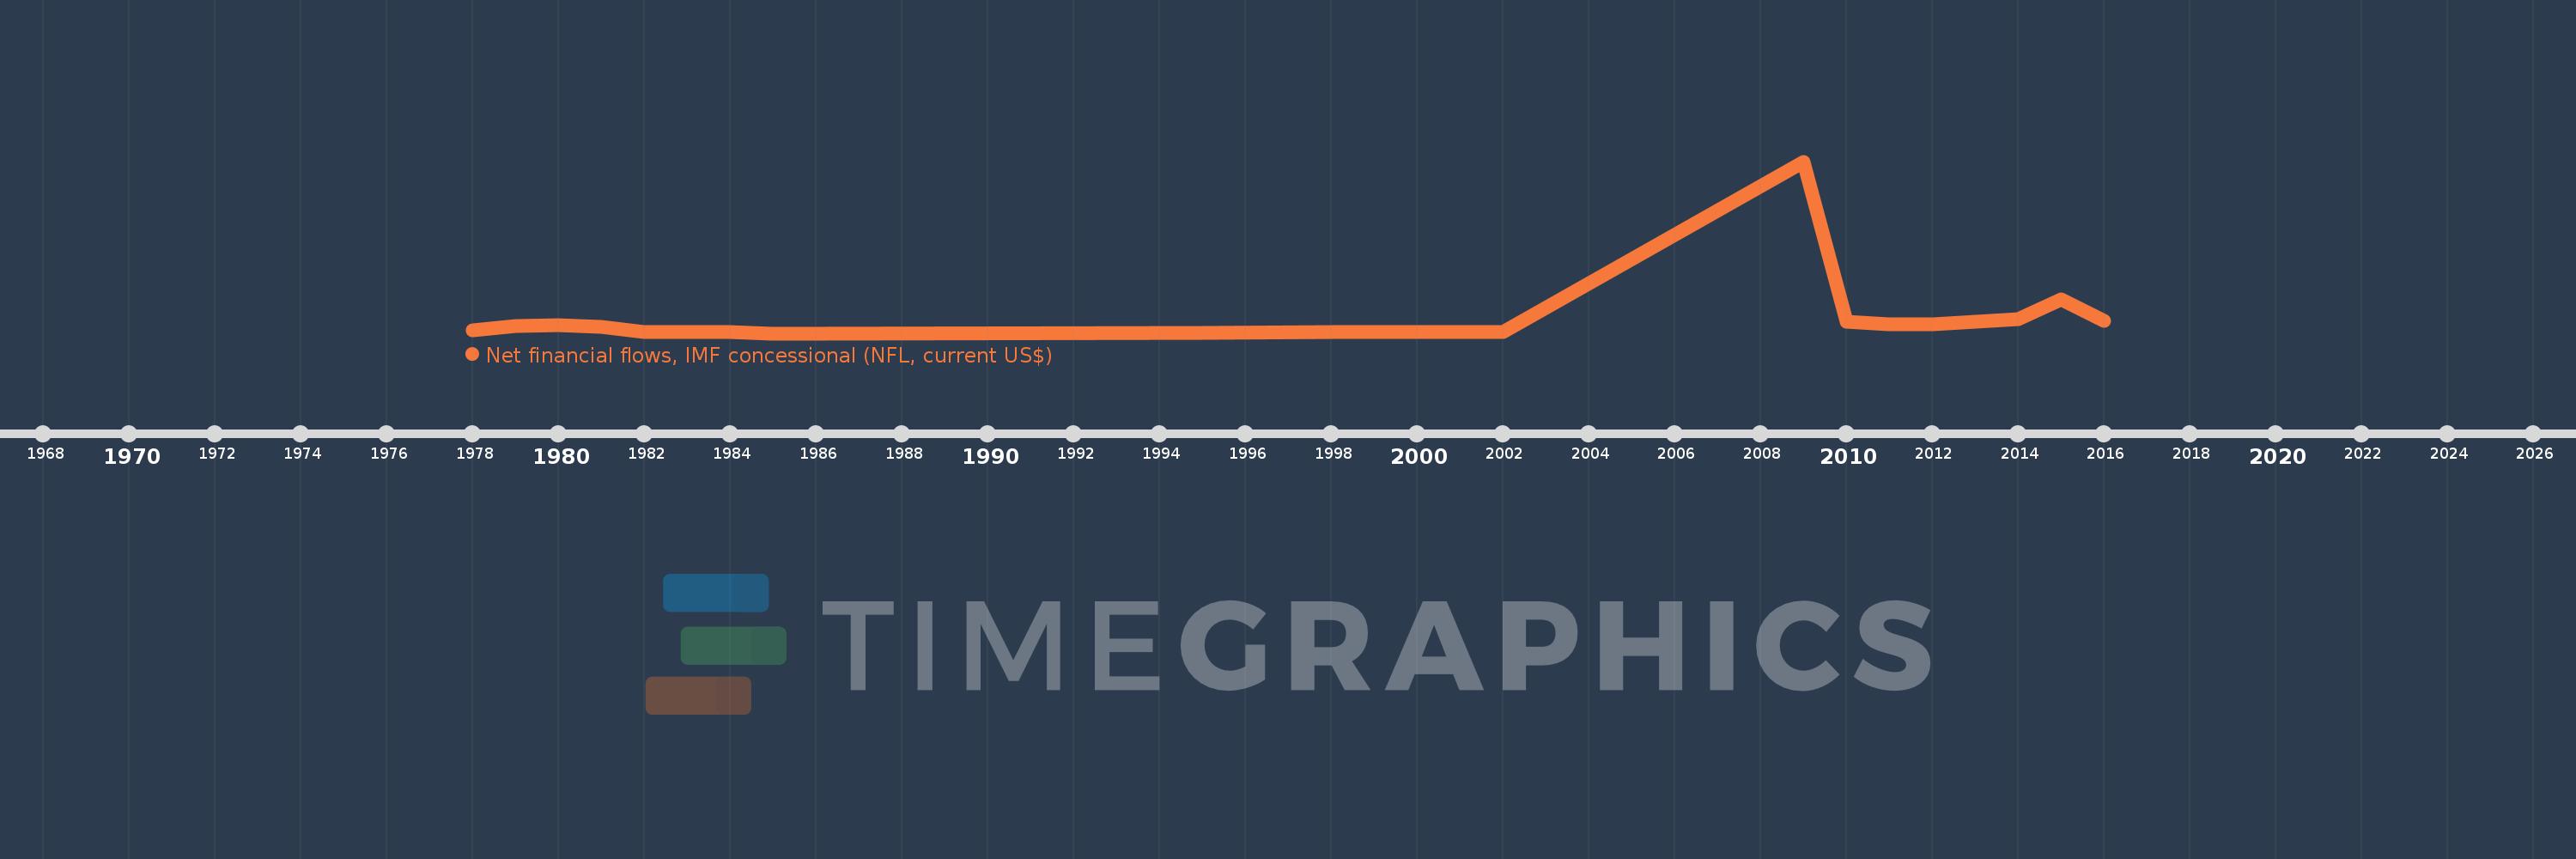
Liberia
LBR
true
2
1
Net financial flows, IMF concessional (NFL, current US$)
2016,2015,2014,2013,2012,2011,2010,2009,2002,2001,2000,1999,1998,1995,1985,1984,1983,1982,1981,1980,1979,1978