33
/
AIzaSyB4mHJ5NPEv-XzF7P6NDYXjlkCWaeKw5bc
November 30, 2025
233892
Sao Tome and Principe
STP
true
2
1
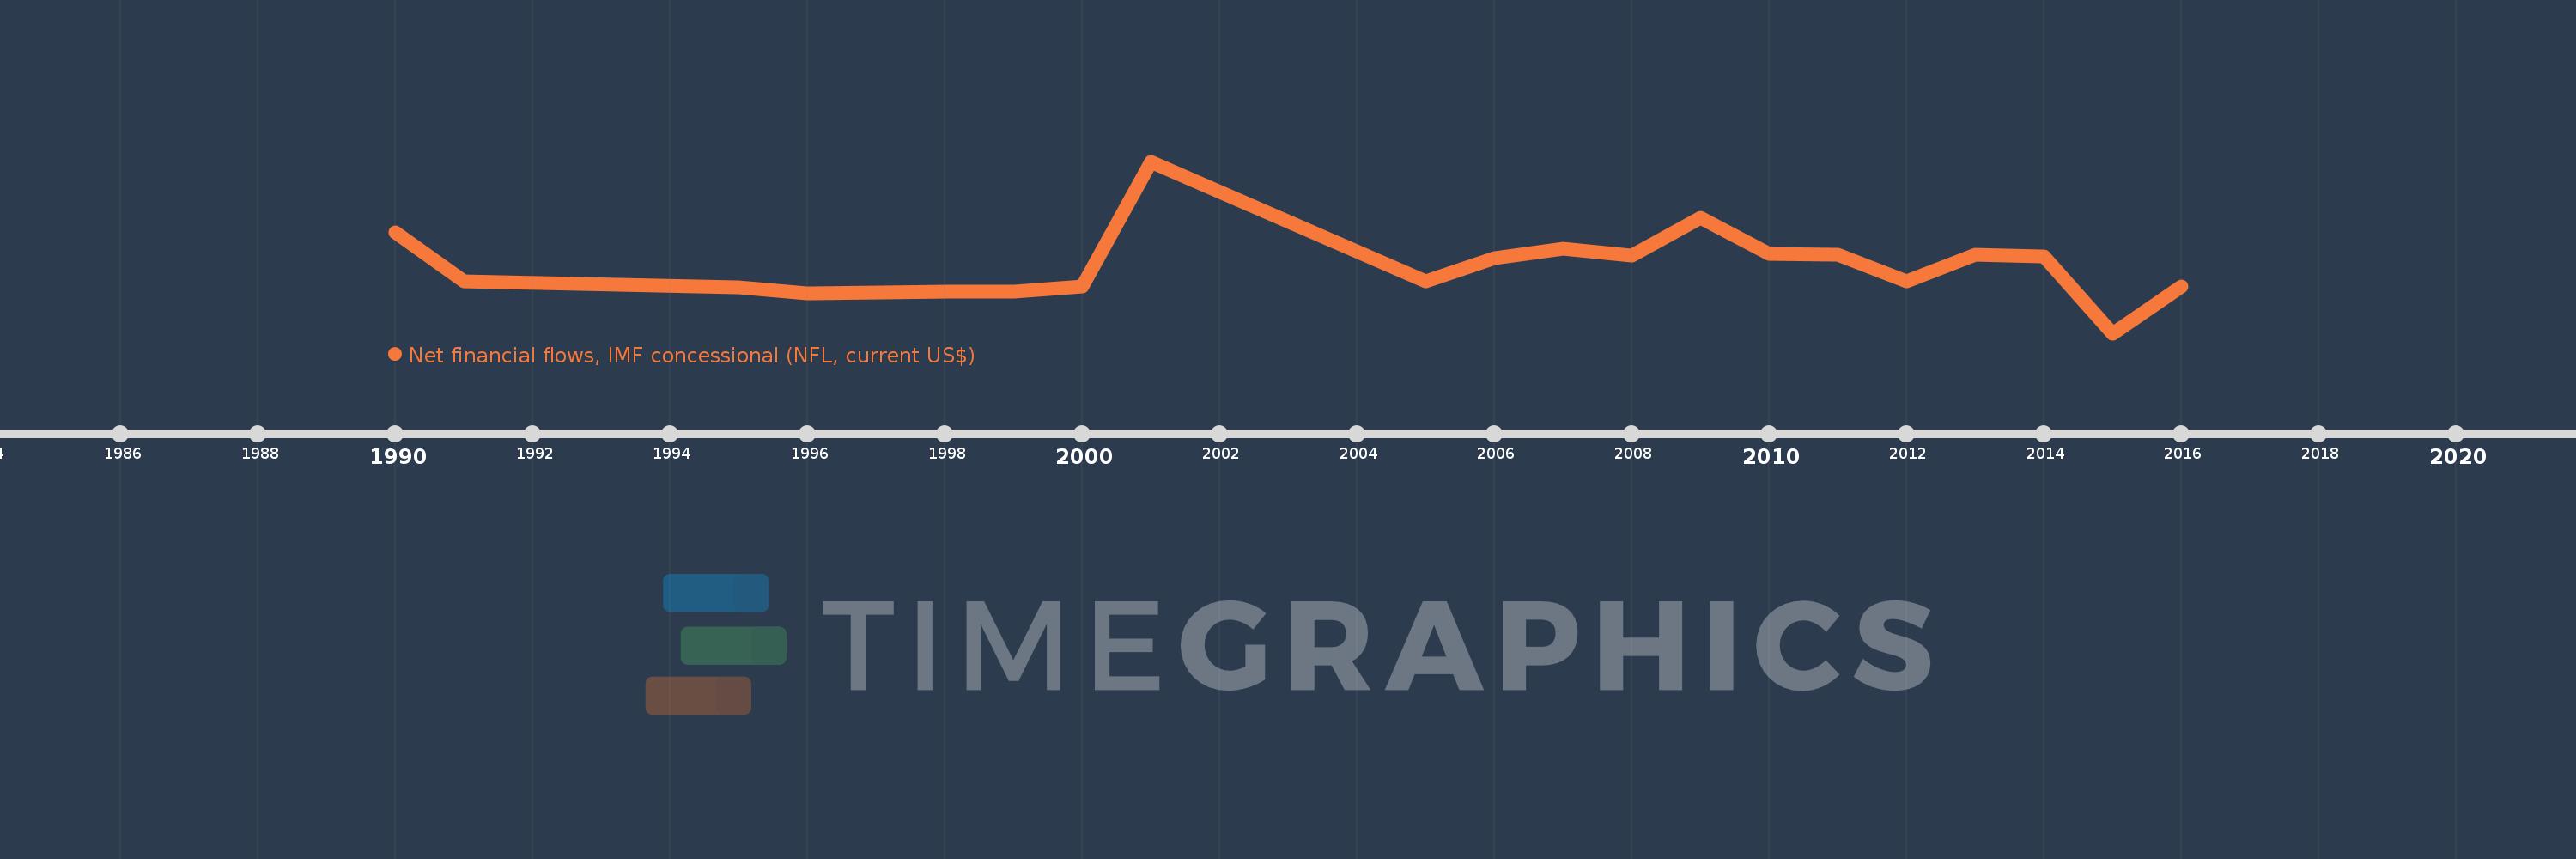
Net financial flows, IMF concessional (NFL, current US$)
2016,2015,2014,2013,2012,2011,2010,2009,2008,2007,2006,2005,2001,2000,1999,1998,1997,1996,1995,1991,1990