33
/
AIzaSyB4mHJ5NPEv-XzF7P6NDYXjlkCWaeKw5bc
November 30, 2025
266142
Tonga
TON
true
2
1
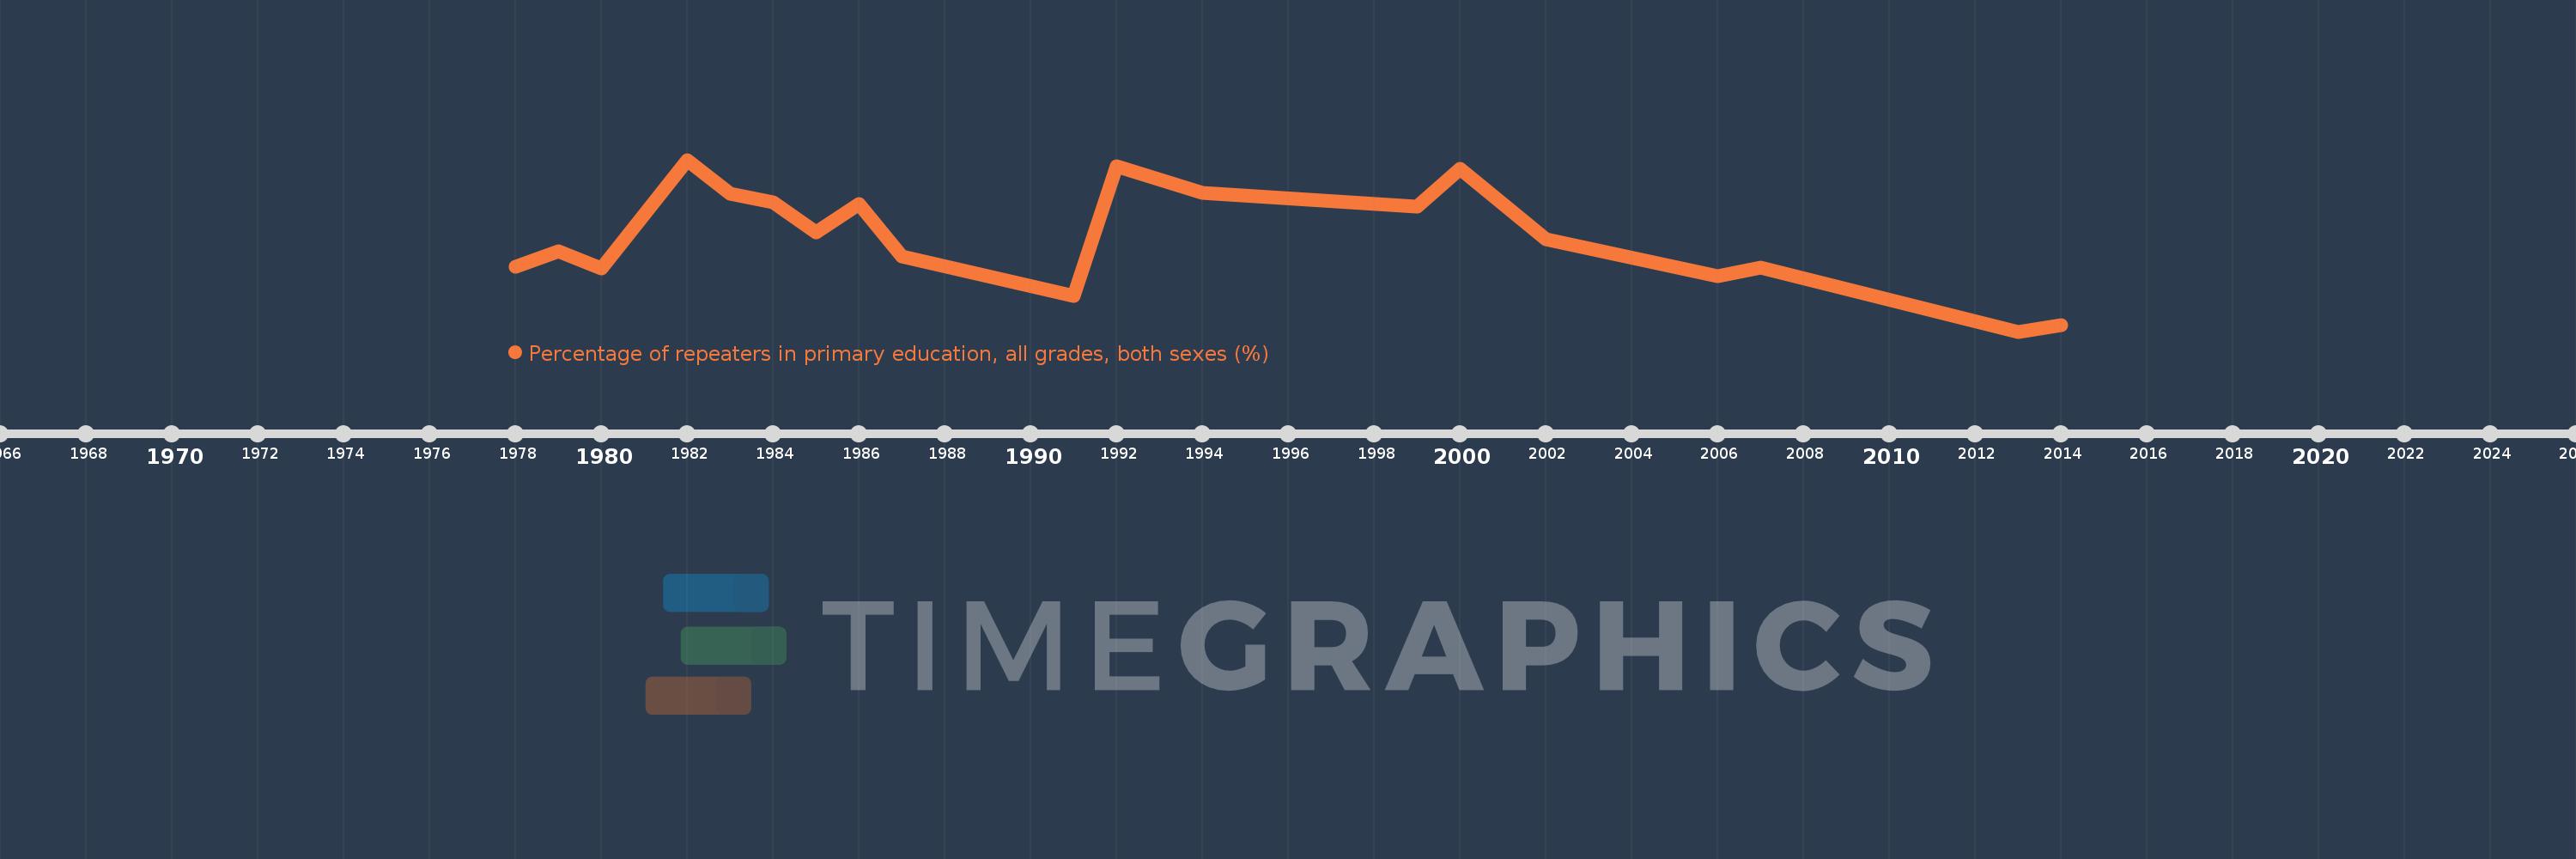
Percentage of repeaters in primary education, all grades, both sexes (%)
2014,2013,2007,2006,2002,2000,1999,1994,1992,1991,1987,1986,1985,1984,1983,1982,1980,1979,1978