33
/
AIzaSyB4mHJ5NPEv-XzF7P6NDYXjlkCWaeKw5bc
November 30, 2025
102857
Central African Republic
CAF
true
2
1
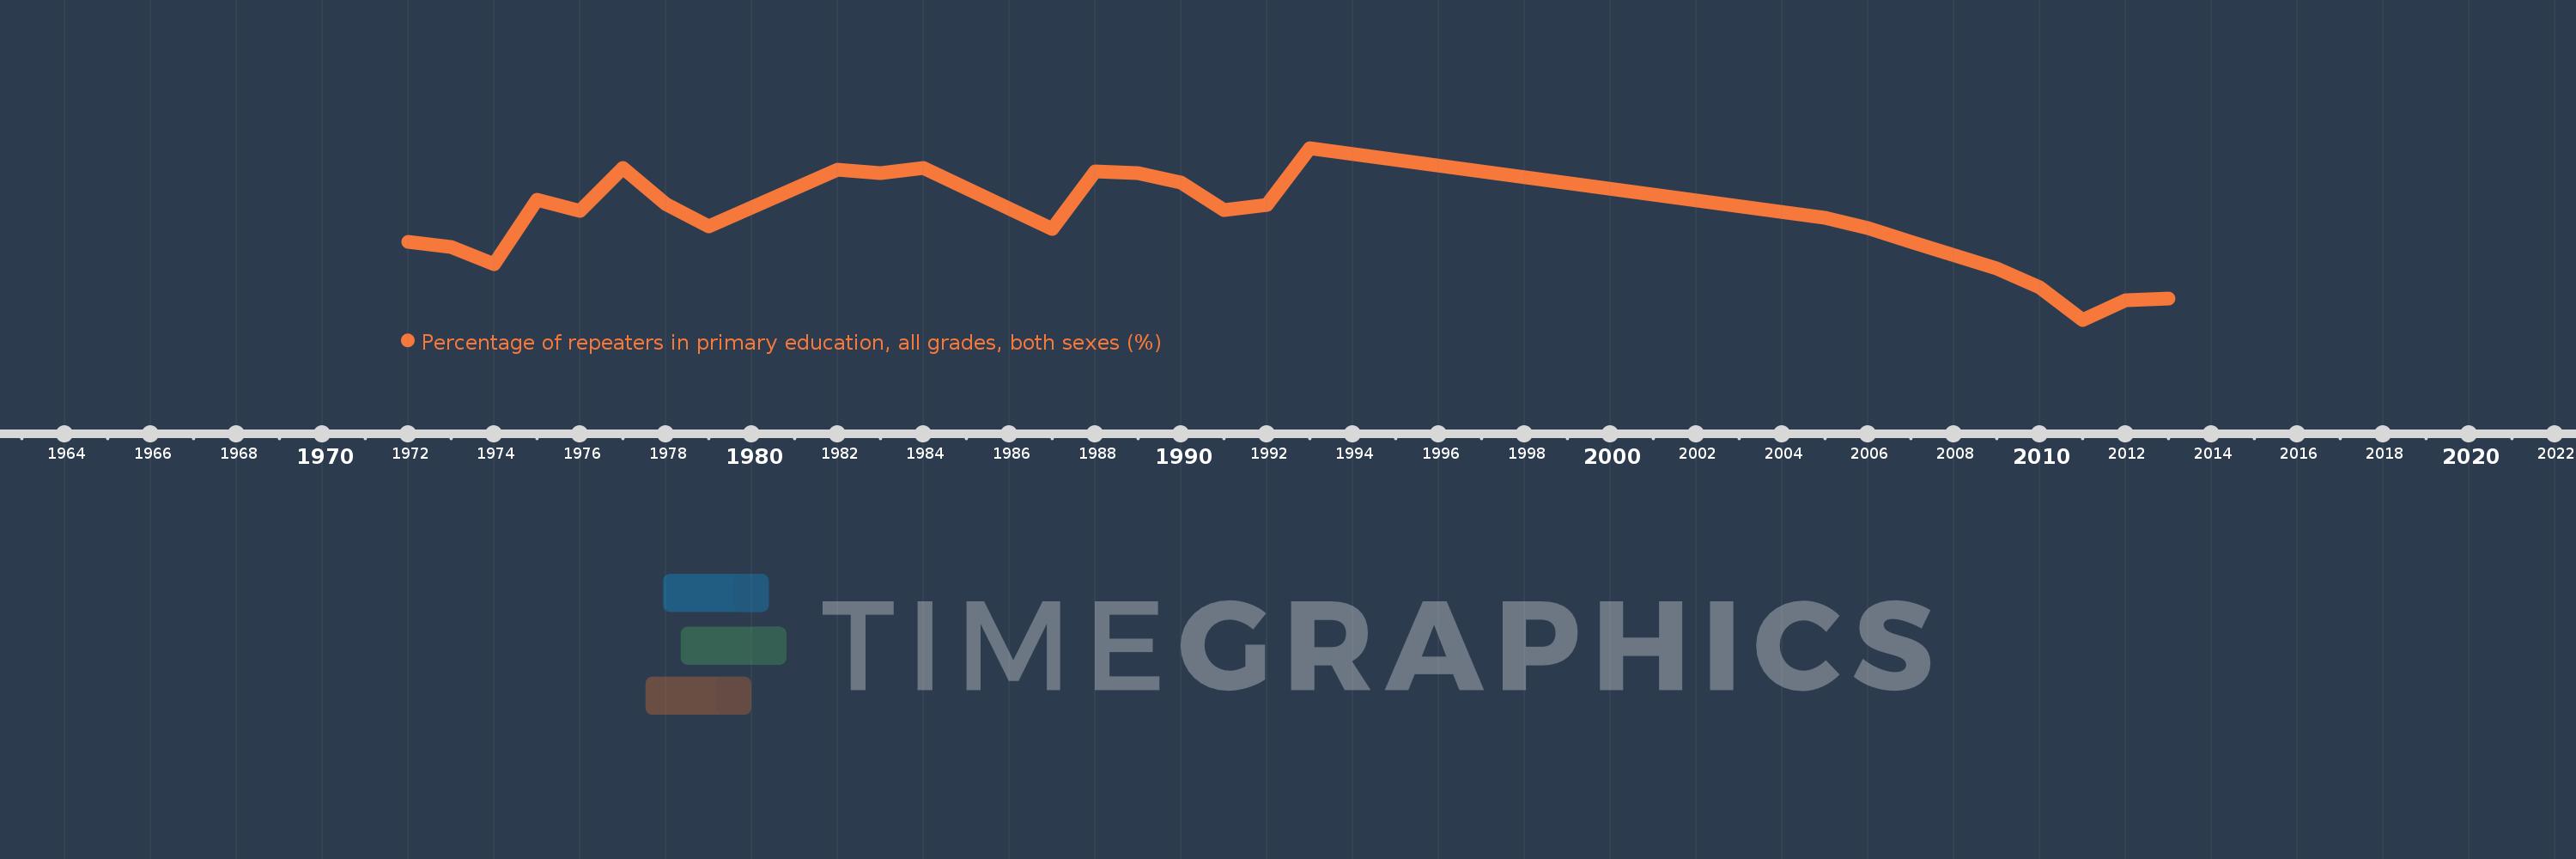
Percentage of repeaters in primary education, all grades, both sexes (%)
2013,2012,2011,2010,2009,2007,2006,2005,1993,1992,1991,1990,1989,1988,1987,1984,1983,1982,1979,1978,1977,1976,1975,1974,1973,1972