33
/
AIzaSyB4mHJ5NPEv-XzF7P6NDYXjlkCWaeKw5bc
November 30, 2025
244001
Solomon Islands
SLB
true
2
1
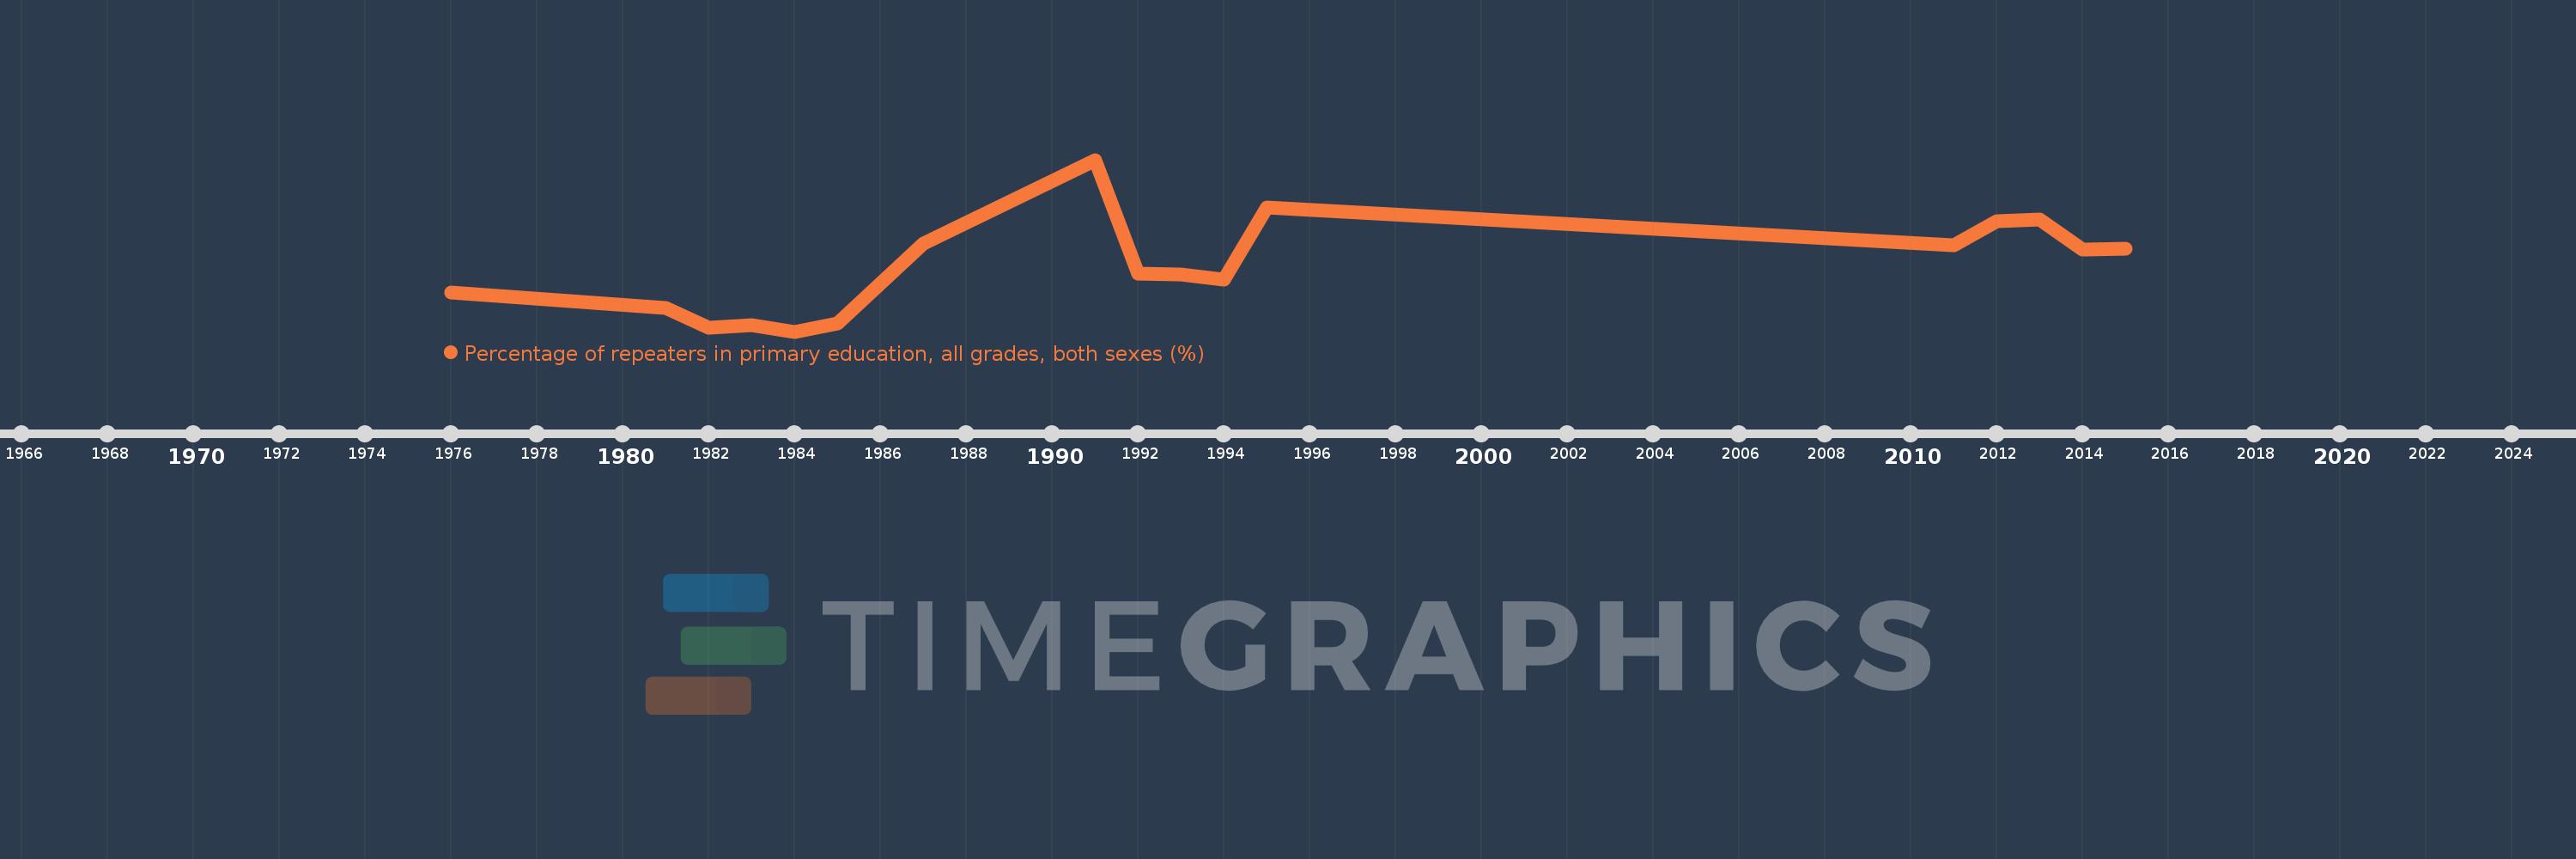
Percentage of repeaters in primary education, all grades, both sexes (%)
2015,2014,2013,2012,2011,1995,1994,1993,1992,1991,1987,1985,1984,1983,1982,1981,1976