33
/
AIzaSyB4mHJ5NPEv-XzF7P6NDYXjlkCWaeKw5bc
November 30, 2025
140859
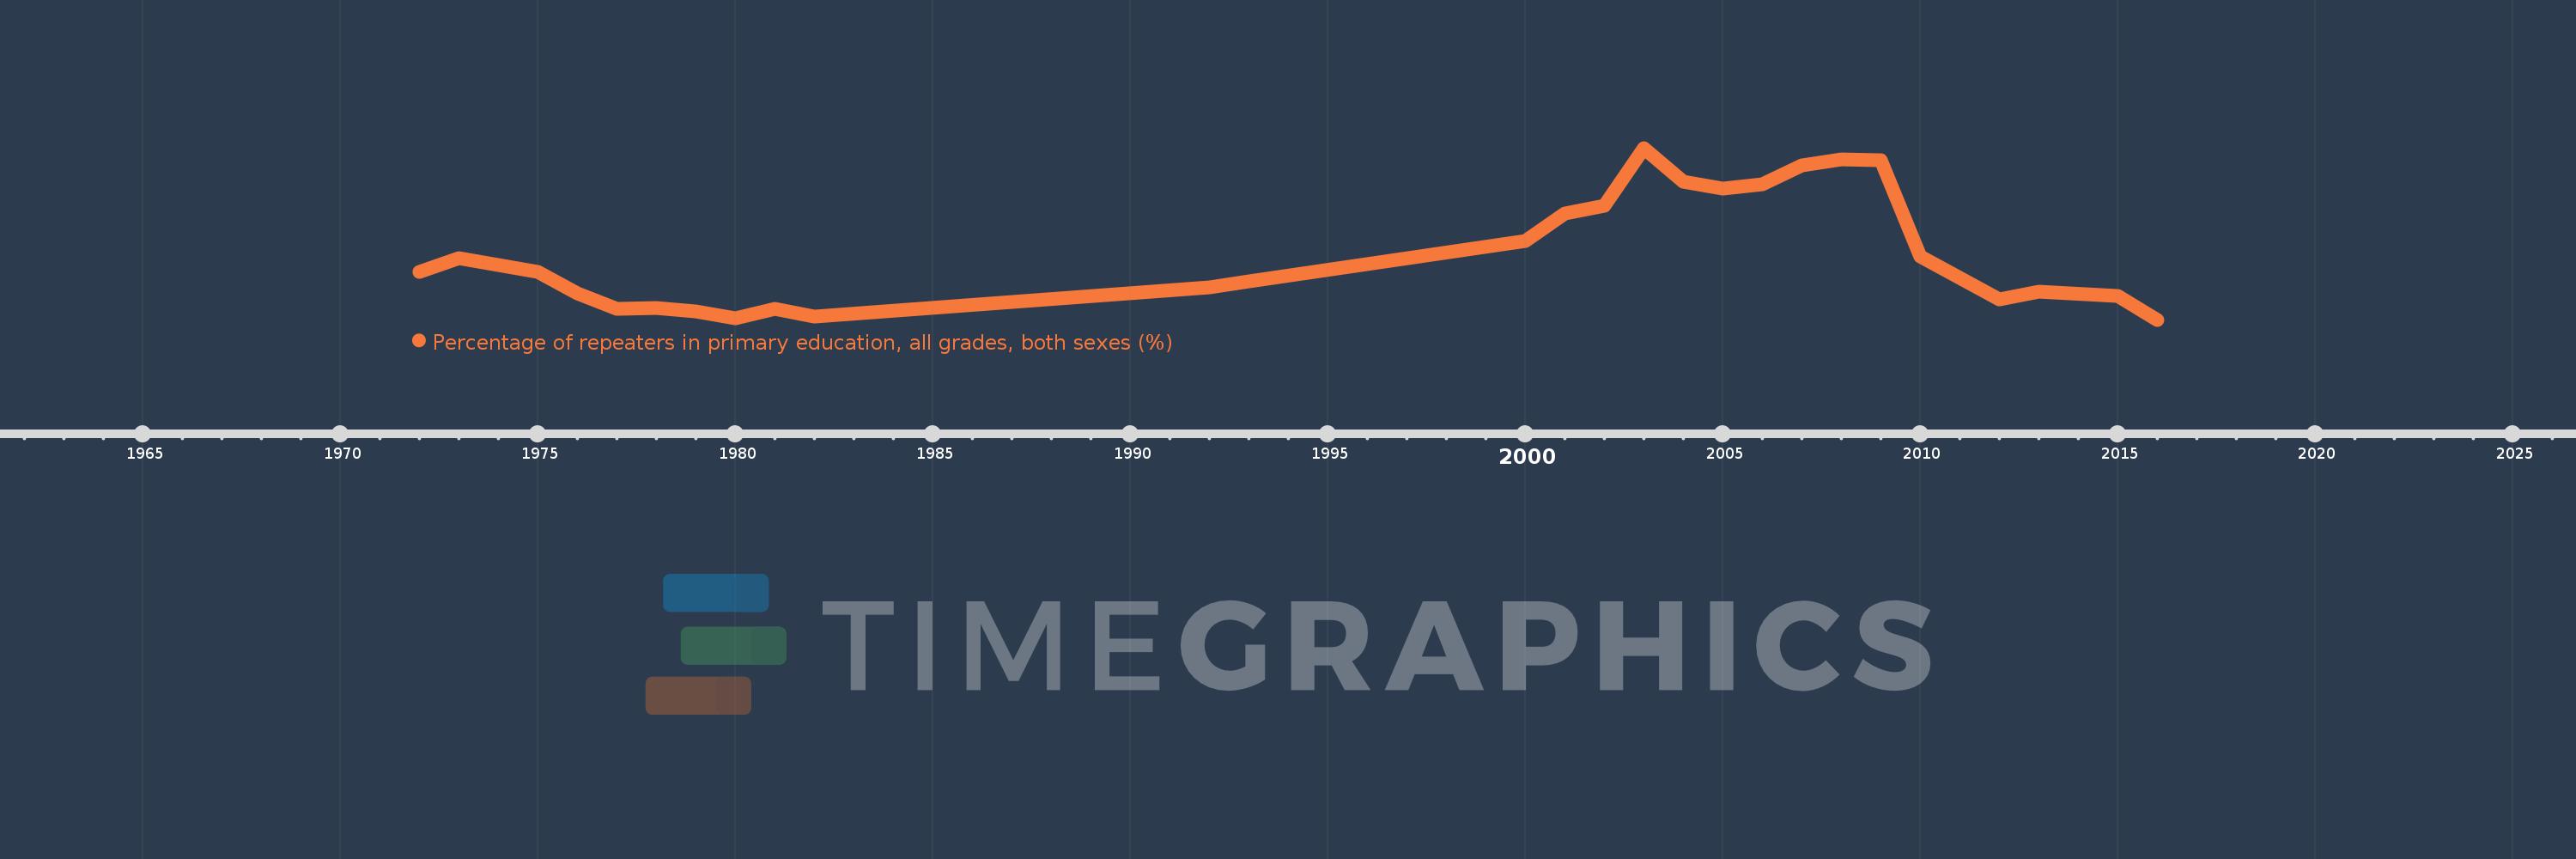
Ghana
GHA
true
2
1
Percentage of repeaters in primary education, all grades, both sexes (%)
2016,2015,2013,2012,2010,2009,2008,2007,2006,2005,2004,2003,2002,2001,2000,1993,1992,1982,1981,1980,1979,1978,1977,1976,1975,1973,1972