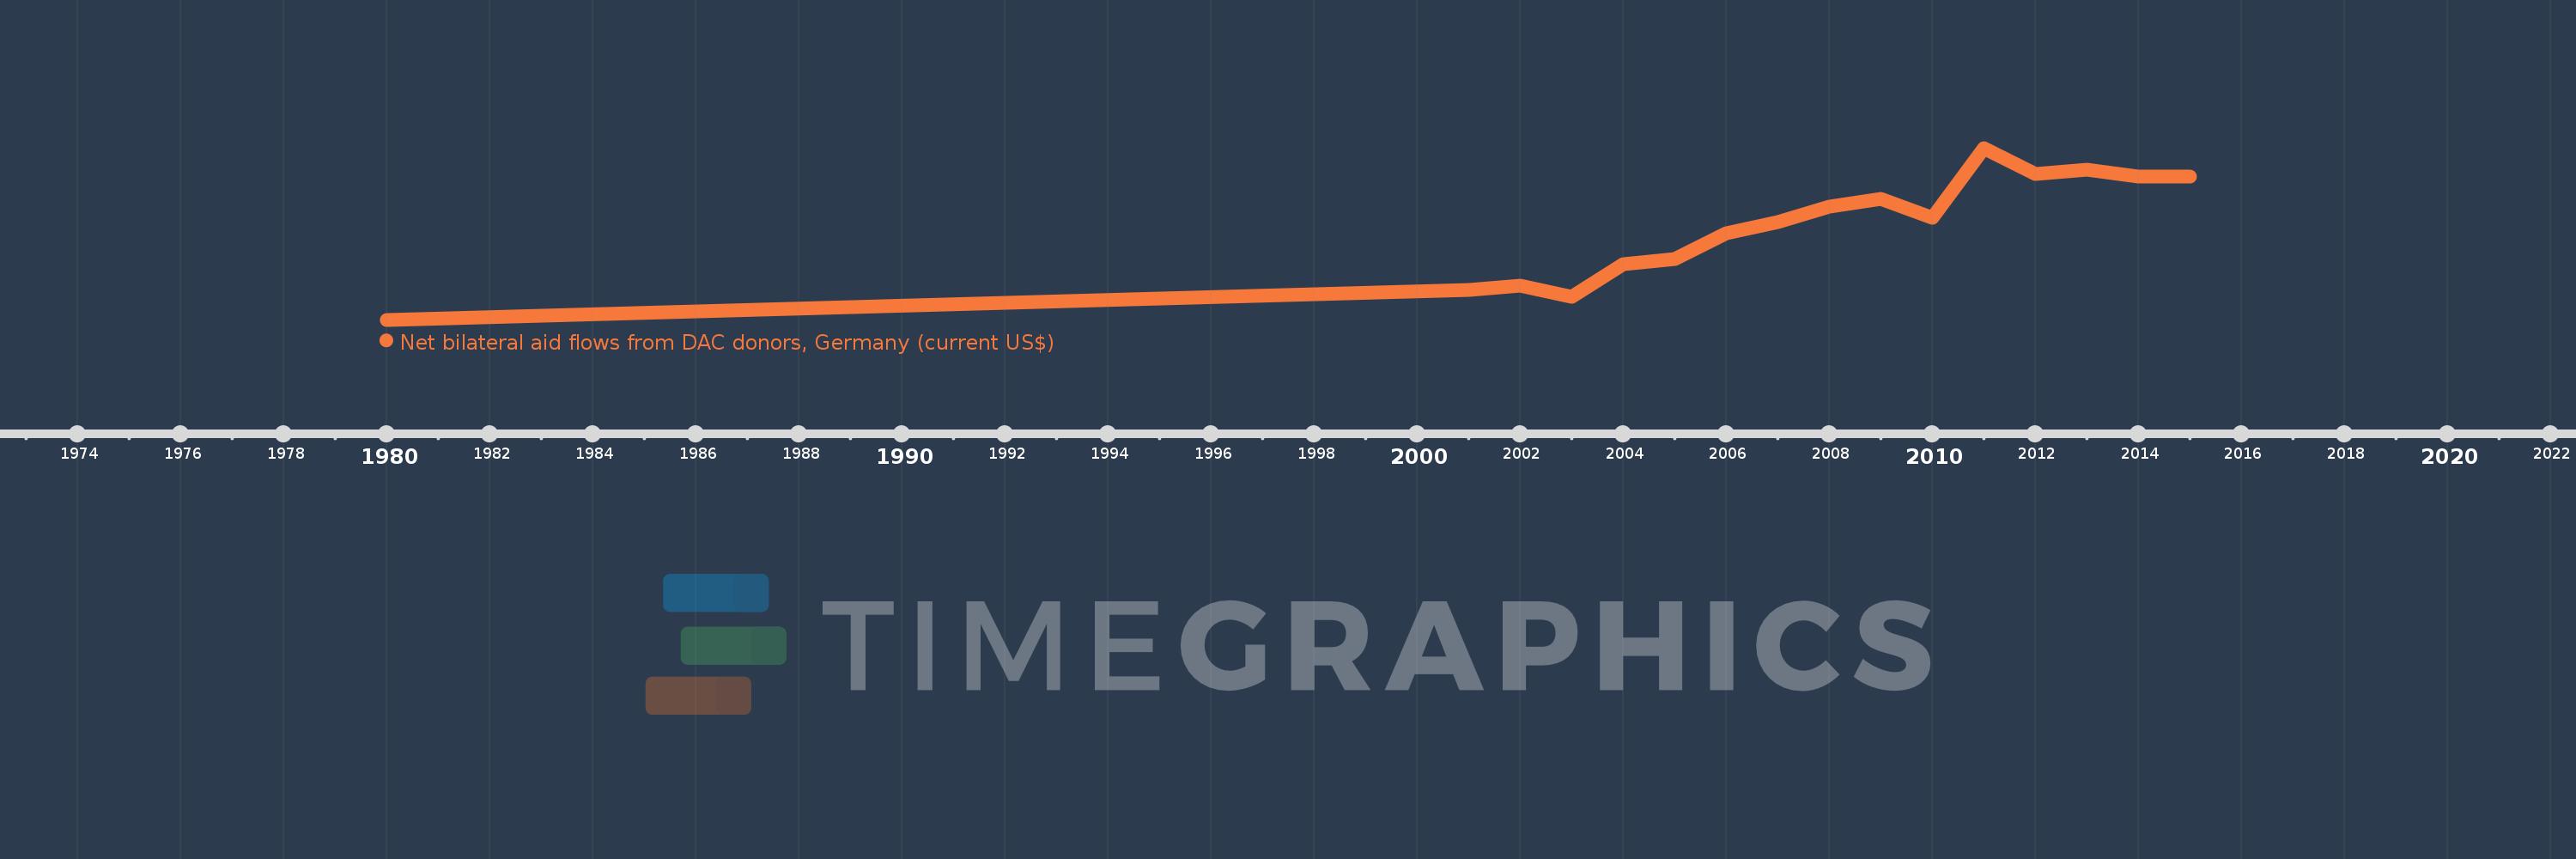
This timeline shows a graph from 1980 to 2015 of Timor-Leste. No data until 1979. Number of actual observations by date: 16.
Source name:
World Development Indicators
Source organization:
Development Assistance Committee of the Organisation for Economic Co-operation and Development, Geographical Distribution of Financial Flows to Developing Countries, Development Co-operation Report, and International Development Statistics database. Data are available online at: www.oecd.org/dac/stats/idsonline.
Categories, topics:
Aid Effectiveness
Last updated:
apr 23, 2017
Indicators value changes by year
Meaning:
5.111 mln
Minimum:
110.0K
jan 1, 1980
Maximum:
9.42 mln
jan 1, 2011
At the date of observation
Value
Absolute change
Change from the previous value
jan 1, 1980
110.0K
+110.0K
0.0%
jan 1, 2001
1.73 mln
+1.62 mln
1.47K%
jan 1, 2002
1.97 mln
+240.0K
13.87%
jan 1, 2003
1.34 mln
-630.0K
-31.98%
jan 1, 2004
3.1 mln
+1.76 mln
131.34%
jan 1, 2005
3.38 mln
+280.0K
9.03%
jan 1, 2006
4.79 mln
+1.41 mln
41.72%
jan 1, 2007
5.38 mln
+590.0K
12.32%
jan 1, 2008
6.24 mln
+860.0K
15.99%
jan 1, 2009
6.66 mln
+420.0K
6.73%
jan 1, 2010
5.63 mln
-1.03 mln
-15.47%
jan 1, 2011
9.42 mln
+3.79 mln
67.32%
jan 1, 2012
8.02 mln
-1.4 mln
-14.86%
jan 1, 2013
8.23 mln
+210.0K
2.62%
jan 1, 2014
7.88 mln
-350.0K
-4.25%
jan 1, 2015
7.89 mln
+10.0K
0.13%
Ranking of countries by current statistics by years