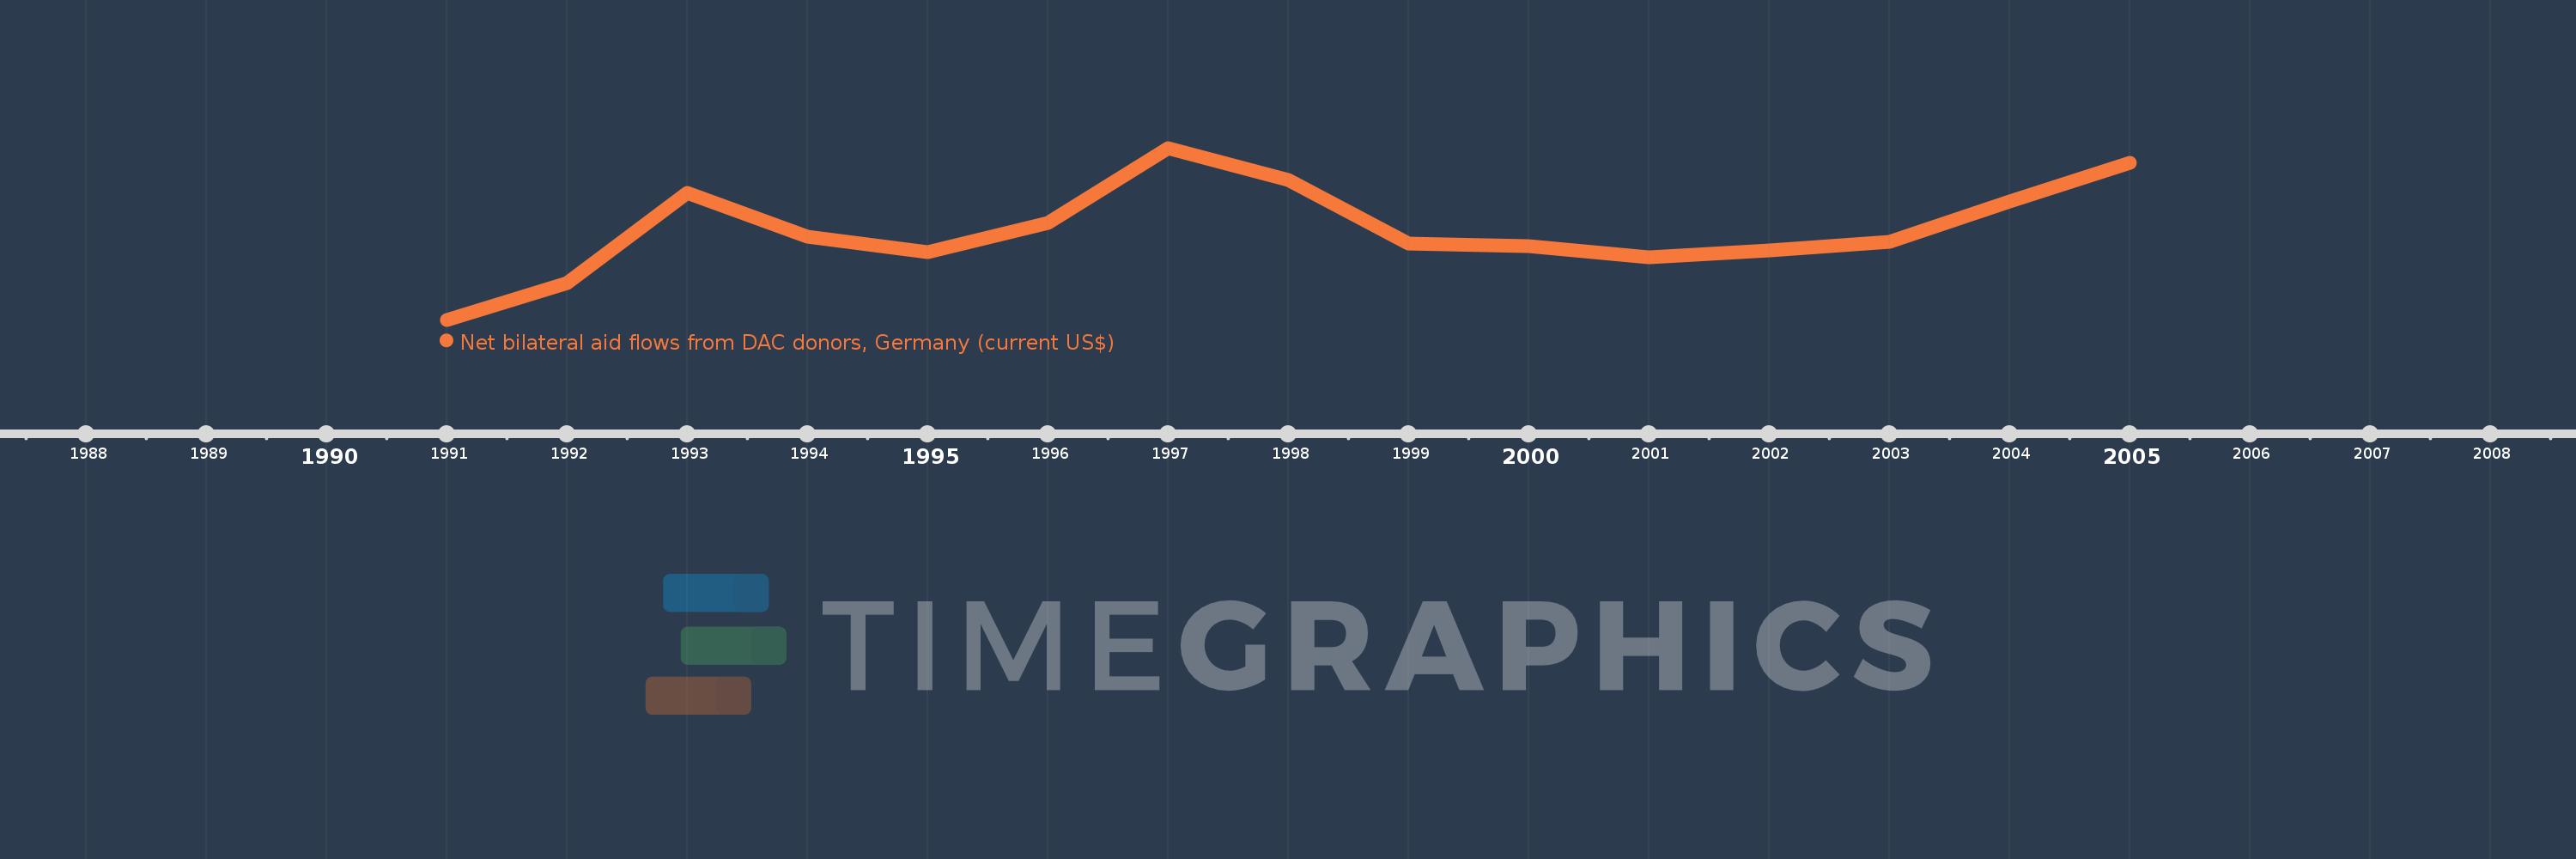
This timeline shows a graph from 1991 to 2005 of Slovak Republic. No data until 1990. Number of actual observations by date: 15.
Source name:
World Development Indicators
Source organization:
Development Assistance Committee of the Organisation for Economic Co-operation and Development, Geographical Distribution of Financial Flows to Developing Countries, Development Co-operation Report, and International Development Statistics database. Data are available online at: www.oecd.org/dac/stats/idsonline.
Categories, topics:
Aid Effectiveness
Last updated:
apr 23, 2017
Indicators value changes by year
Meaning:
7.54 mln
Minimum:
1.59 mln
jan 1, 1991
Maximum:
12.88 mln
jan 1, 1997
At the date of observation
Value
Absolute change
Change from the previous value
jan 1, 1991
1.59 mln
+1.59 mln
0.0%
jan 1, 1992
4.0 mln
+2.41 mln
151.57%
jan 1, 1993
9.9 mln
+5.9 mln
147.5%
jan 1, 1994
7.06 mln
-2.84 mln
-28.69%
jan 1, 1995
6.04 mln
-1.02 mln
-14.45%
jan 1, 1996
7.96 mln
+1.92 mln
31.79%
jan 1, 1997
12.88 mln
+4.92 mln
61.81%
jan 1, 1998
10.8 mln
-2.08 mln
-16.15%
jan 1, 1999
6.58 mln
-4.22 mln
-39.07%
jan 1, 2000
6.4 mln
-180.0K
-2.74%
jan 1, 2001
5.72 mln
-680.0K
-10.62%
jan 1, 2002
6.14 mln
+420.0K
7.34%
jan 1, 2003
6.73 mln
+590.0K
9.61%
jan 1, 2004
9.37 mln
+2.64 mln
39.23%
jan 1, 2005
11.93 mln
+2.56 mln
27.32%
Ranking of countries by current statistics by years