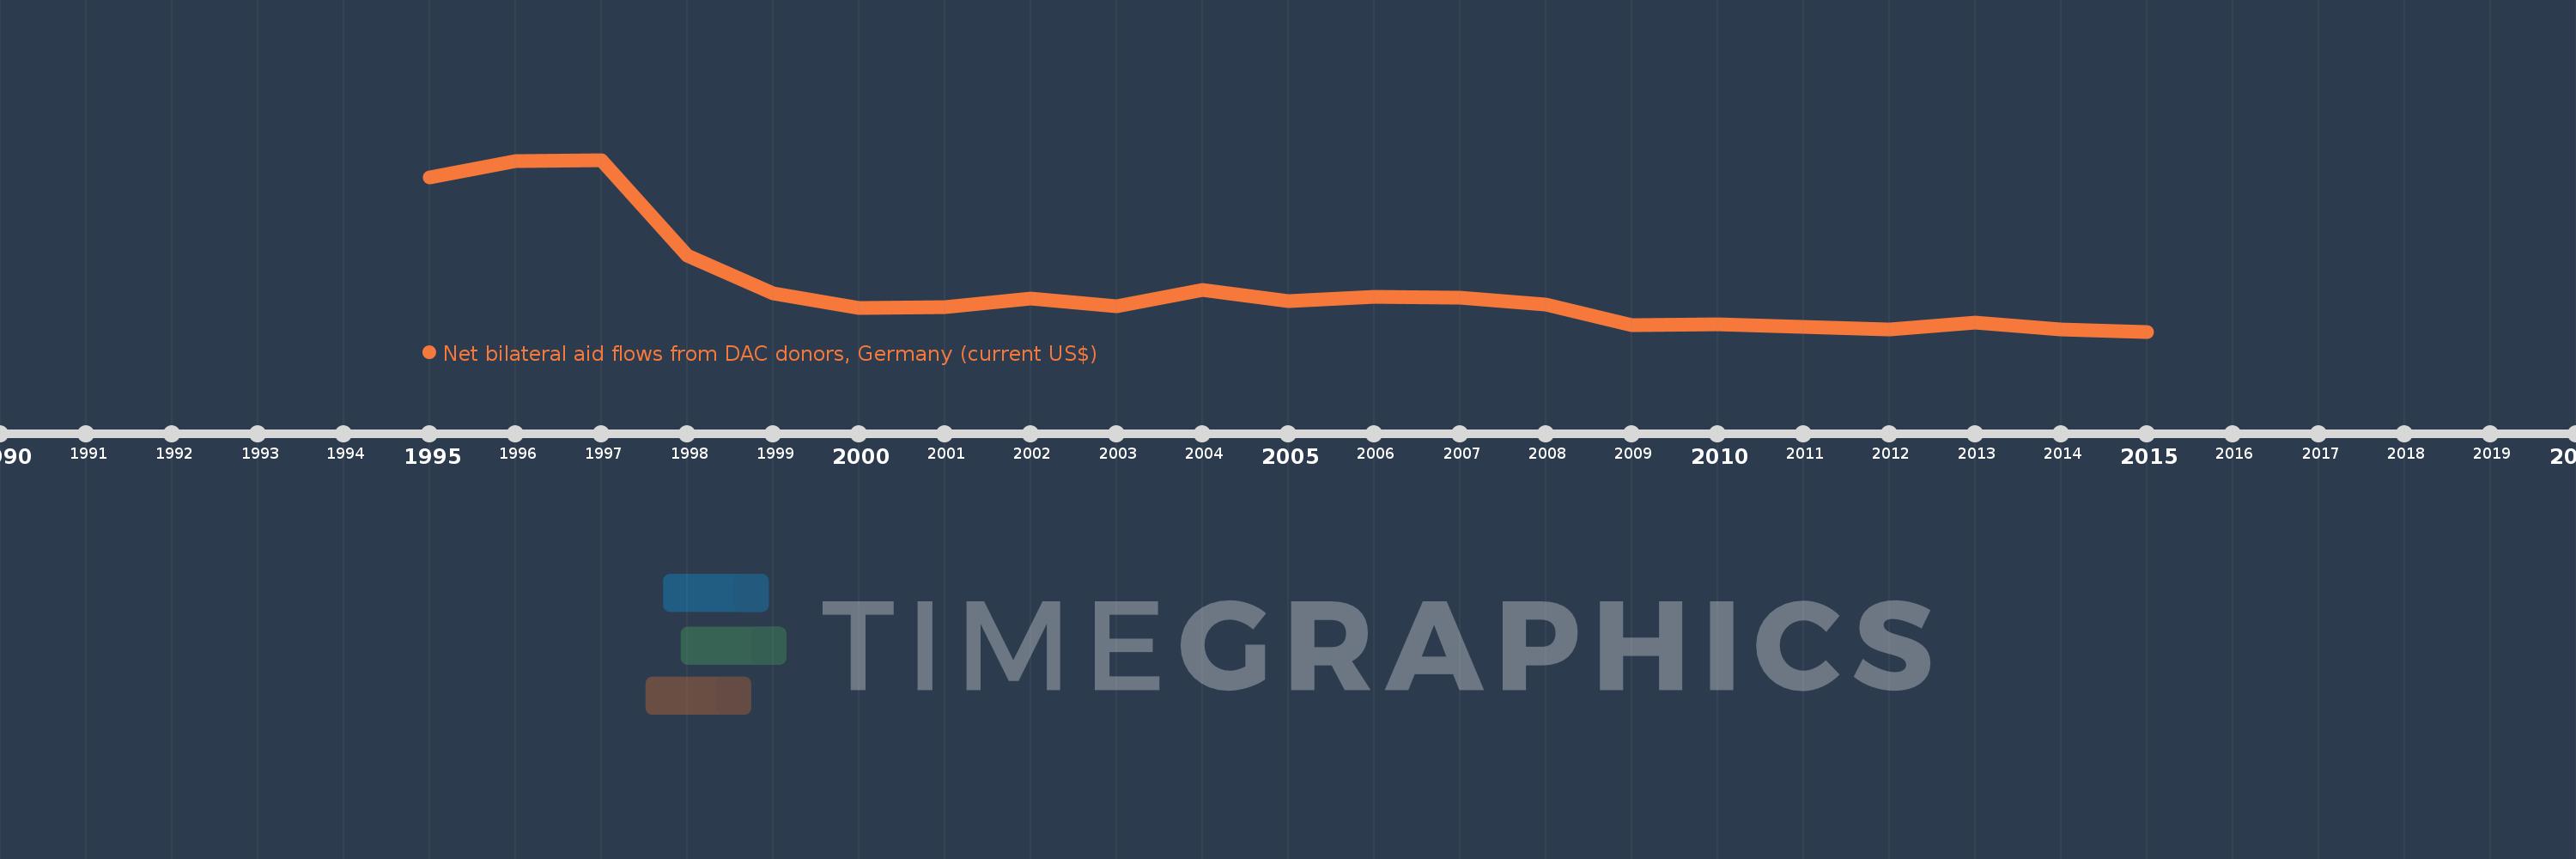
This timeline shows a graph from 1995 to 2015 of Eritrea. No data until 1994. Number of actual observations by date: 21.
Source name:
World Development Indicators
Source organization:
Development Assistance Committee of the Organisation for Economic Co-operation and Development, Geographical Distribution of Financial Flows to Developing Countries, Development Co-operation Report, and International Development Statistics database. Data are available online at: www.oecd.org/dac/stats/idsonline.
Categories, topics:
Aid Effectiveness
Last updated:
apr 23, 2017
Indicators value changes by year
Meaning:
6.041 mln
Minimum:
490.0K
jan 1, 2015
Maximum:
22.28 mln
jan 1, 1997
At the date of observation
Value
Absolute change
Change from the previous value
jan 1, 1995
20.01 mln
+20.01 mln
0.0%
jan 1, 1996
22.13 mln
+2.12 mln
10.59%
jan 1, 1997
22.28 mln
+150.0K
0.68%
jan 1, 1998
10.16 mln
-12.12 mln
-54.4%
jan 1, 1999
5.38 mln
-4.78 mln
-47.05%
jan 1, 2000
3.49 mln
-1.89 mln
-35.13%
jan 1, 2001
3.64 mln
+150.0K
4.3%
jan 1, 2002
4.72 mln
+1.08 mln
29.67%
jan 1, 2003
3.7 mln
-1.02 mln
-21.61%
jan 1, 2004
5.8 mln
+2.1 mln
56.76%
jan 1, 2005
4.35 mln
-1.45 mln
-25.0%
jan 1, 2006
4.92 mln
+570.0K
13.1%
jan 1, 2007
4.83 mln
-90.0K
-1.83%
jan 1, 2008
3.9 mln
-930.0K
-19.25%
jan 1, 2009
1.28 mln
-2.62 mln
-67.18%
jan 1, 2010
1.43 mln
+150.0K
11.72%
jan 1, 2011
1.14 mln
-290.0K
-20.28%
jan 1, 2012
800.0K
-340.0K
-29.82%
jan 1, 2013
1.61 mln
+810.0K
101.25%
jan 1, 2014
800.0K
-810.0K
-50.31%
jan 1, 2015
490.0K
-310.0K
-38.75%
Ranking of countries by current statistics by years