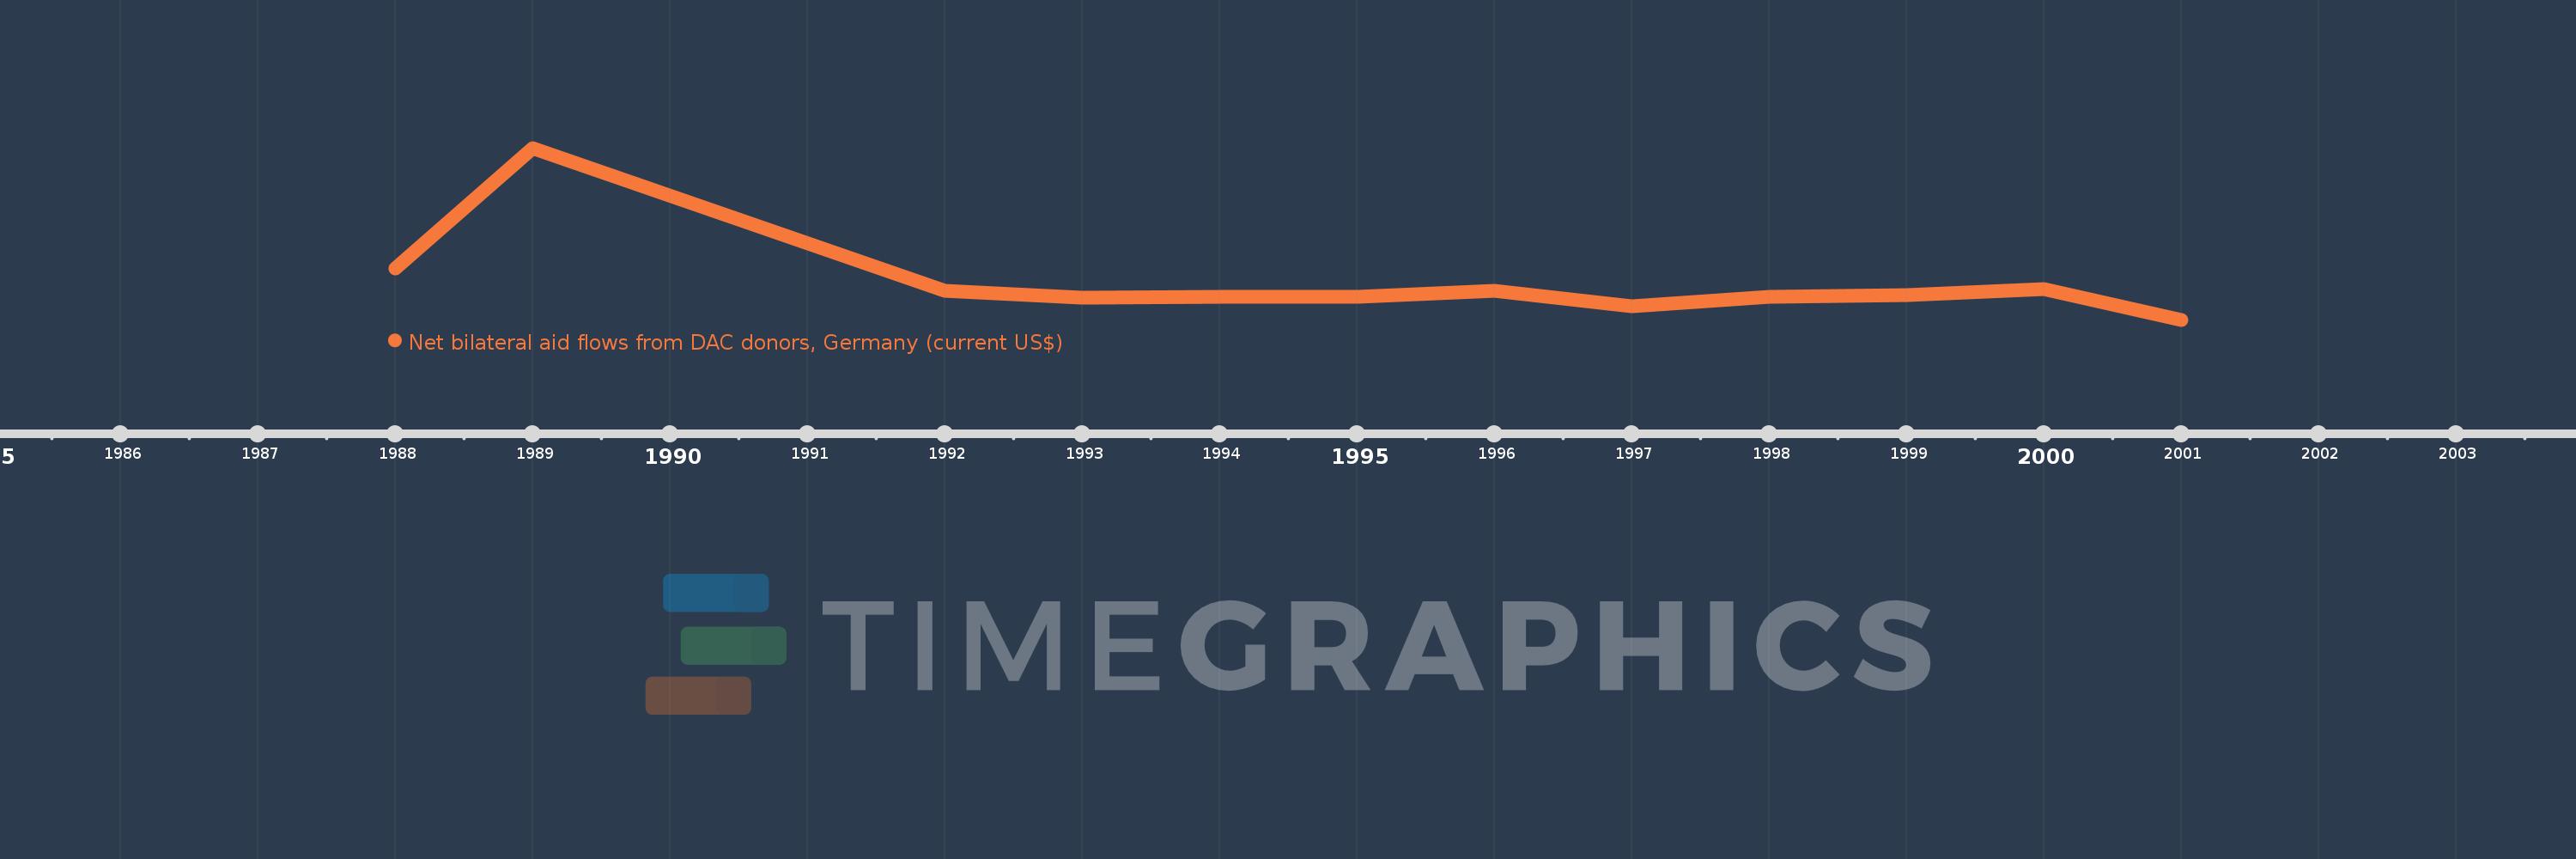
This timeline shows a graph from 1988 to 2001 of Cayman Islands. No data until 1987. Number of actual observations by date: 12.
Source name:
World Development Indicators
Source organization:
Development Assistance Committee of the Organisation for Economic Co-operation and Development, Geographical Distribution of Financial Flows to Developing Countries, Development Co-operation Report, and International Development Statistics database. Data are available online at: www.oecd.org/dac/stats/idsonline.
Categories, topics:
Aid Effectiveness
Last updated:
apr 23, 2017
Indicators value changes by year
Meaning:
26.667K
Minimum:
-3.12 mln
jan 1, 2001
Maximum:
11.59 mln
jan 1, 1989
At the date of observation
Value
Absolute change
Change from the previous value
jan 1, 1988
1.25 mln
+1.25 mln
0.0%
jan 1, 1989
11.59 mln
+10.34 mln
827.2%
jan 1, 1992
-620.0K
-12.21 mln
-105.35%
jan 1, 1993
-1.21 mln
-590.0K
95.16%
jan 1, 1994
-1.14 mln
+70.0K
-5.79%
jan 1, 1995
-1.16 mln
-20.0K
1.75%
jan 1, 1996
-660.0K
+500.0K
-43.1%
jan 1, 1997
-1.99 mln
-1.33 mln
201.52%
jan 1, 1998
-1.16 mln
+830.0K
-41.71%
jan 1, 1999
-1000.0K
+160.0K
-13.79%
jan 1, 2000
-460.0K
+540.0K
-54.0%
jan 1, 2001
-3.12 mln
-2.66 mln
578.26%
Ranking of countries by current statistics by years