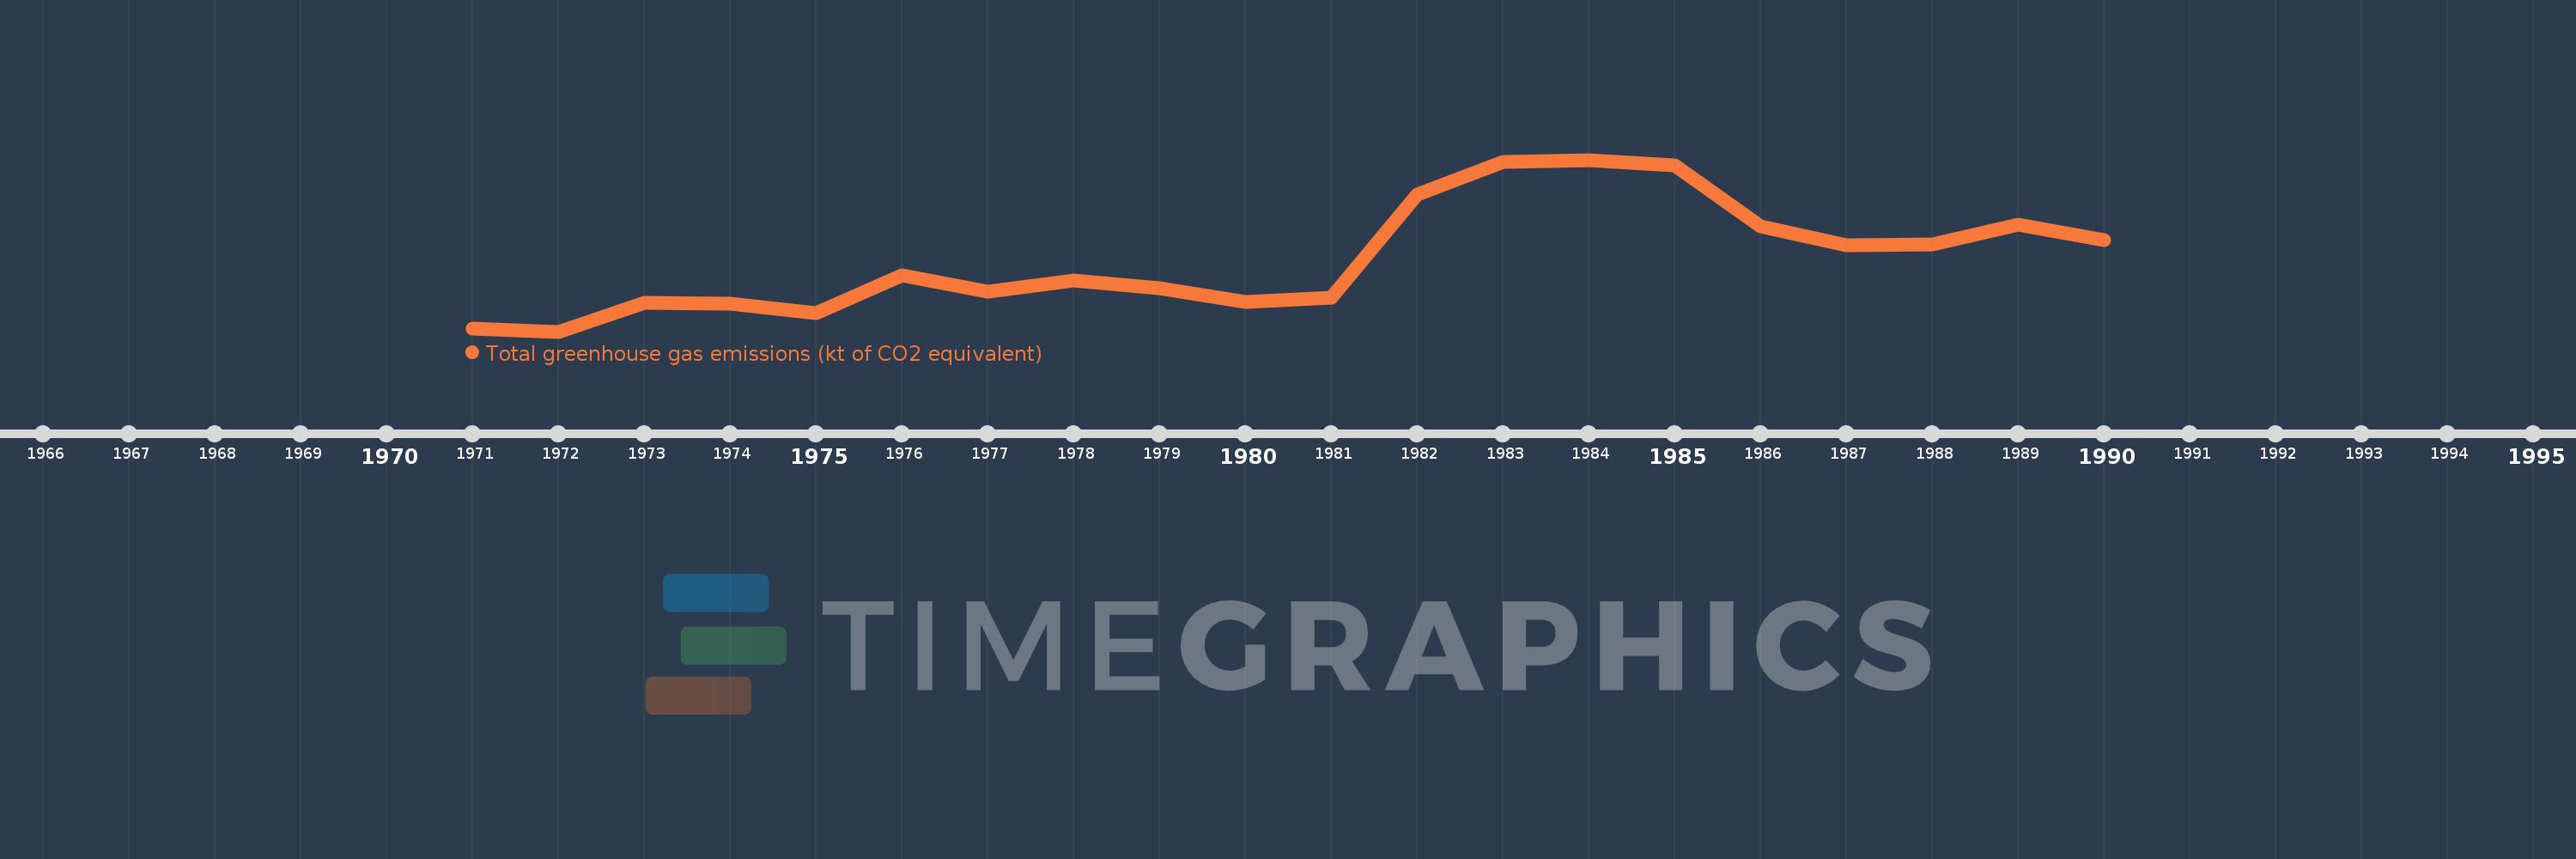
This timeline shows a graph from 1971 to 1990 of St. Kitts and Nevis. No data until 1970. Number of actual observations by date: 20.
Source name:
World Development Indicators
Source organization:
European Commission, Joint Research Centre (JRC)/Netherlands Environmental Assessment Agency (PBL). Emission Database for Global Atmospheric Research (EDGAR), EDGARv4.2 FT2012: http://edgar.jrc.ec.europa.eu/
Categories, topics:
Climate Change, Environment
Last updated:
apr 23, 2017
Indicators value changes by year
Meaning:
94.752
Minimum:
63.485
jan 1, 1972
Maximum:
137.265
jan 1, 1984
At the date of observation
Value
Absolute change
Change from the previous value
jan 1, 1971
64.773
+64.773
0.0%
jan 1, 1972
63.485
-1.288
-1.99%
jan 1, 1973
75.853
+12.368
19.48%
jan 1, 1974
75.518
-0.335
-0.44%
jan 1, 1975
71.399
-4.119
-5.45%
jan 1, 1976
87.732
+16.333
22.88%
jan 1, 1977
80.741
-6.99
-7.97%
jan 1, 1978
85.484
+4.743
5.87%
jan 1, 1979
82.05
-3.434
-4.02%
jan 1, 1980
76.385
-5.666
-6.91%
jan 1, 1981
77.951
+1.566
2.05%
jan 1, 1982
122.382
+44.431
57.0%
jan 1, 1983
136.275
+13.893
11.35%
jan 1, 1984
137.265
+0.991
0.73%
jan 1, 1985
135.051
-2.214
-1.61%
jan 1, 1986
108.612
-26.438
-19.58%
jan 1, 1987
100.696
-7.916
-7.29%
jan 1, 1988
100.986
+0.29
0.29%
jan 1, 1989
109.465
+8.479
8.4%
jan 1, 1990
102.938
-6.527
-5.96%
Ranking of countries by current statistics by years