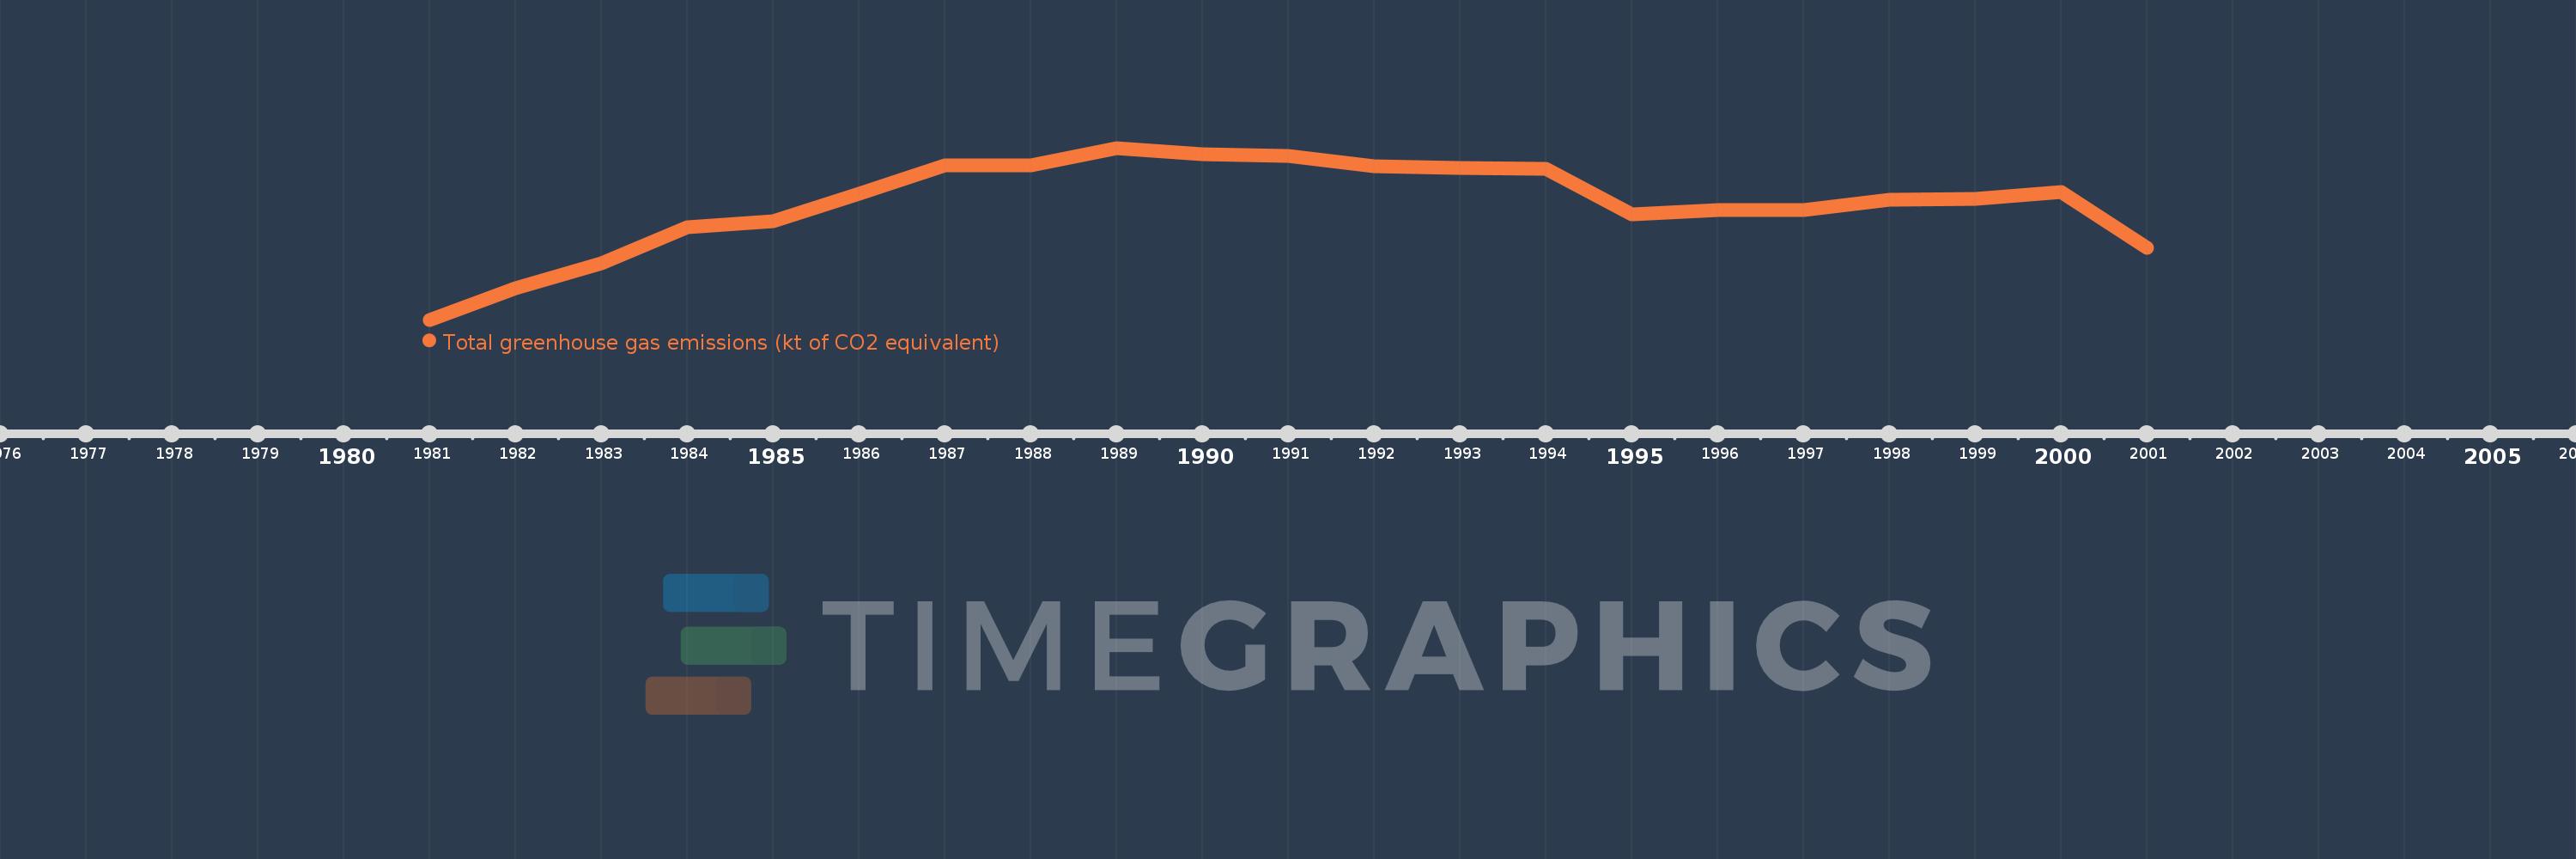
This timeline shows a graph from 1981 to 2001 of French Polynesia. No data until 1980. Number of actual observations by date: 21.
Source name:
World Development Indicators
Source organization:
European Commission, Joint Research Centre (JRC)/Netherlands Environmental Assessment Agency (PBL). Emission Database for Global Atmospheric Research (EDGAR), EDGARv4.2 FT2012: http://edgar.jrc.ec.europa.eu/
Categories, topics:
Climate Change, Environment
Last updated:
apr 23, 2017
Indicators value changes by year
Meaning:
804.833
Minimum:
296.815
jan 1, 1981
Maximum:
1.049K
jan 1, 1989
At the date of observation
Value
Absolute change
Change from the previous value
jan 1, 1981
296.815
+296.815
0.0%
jan 1, 1982
435.137
+138.322
46.6%
jan 1, 1983
545.431
+110.294
25.35%
jan 1, 1984
701.192
+155.761
28.56%
jan 1, 1985
729.282
+28.089
4.01%
jan 1, 1986
848.259
+118.978
16.31%
jan 1, 1987
971.818
+123.558
14.57%
jan 1, 1988
971.42
-0.398
-0.04%
jan 1, 1989
1.049K
+77.454
7.97%
jan 1, 1990
1.021K
-28.14
-2.68%
jan 1, 1991
1.014K
-6.274
-0.61%
jan 1, 1992
970.225
-44.235
-4.36%
jan 1, 1993
960.668
-9.557
-0.99%
jan 1, 1994
956.927
-3.741
-0.39%
jan 1, 1995
758.915
-198.012
-20.69%
jan 1, 1996
777.497
+18.582
2.45%
jan 1, 1997
778.386
+0.889
0.11%
jan 1, 1998
821.247
+42.861
5.51%
jan 1, 1999
827.622
+6.375
0.78%
jan 1, 2000
856.485
+28.863
3.49%
jan 1, 2001
610.095
-246.39
-28.77%
Ranking of countries by current statistics by years