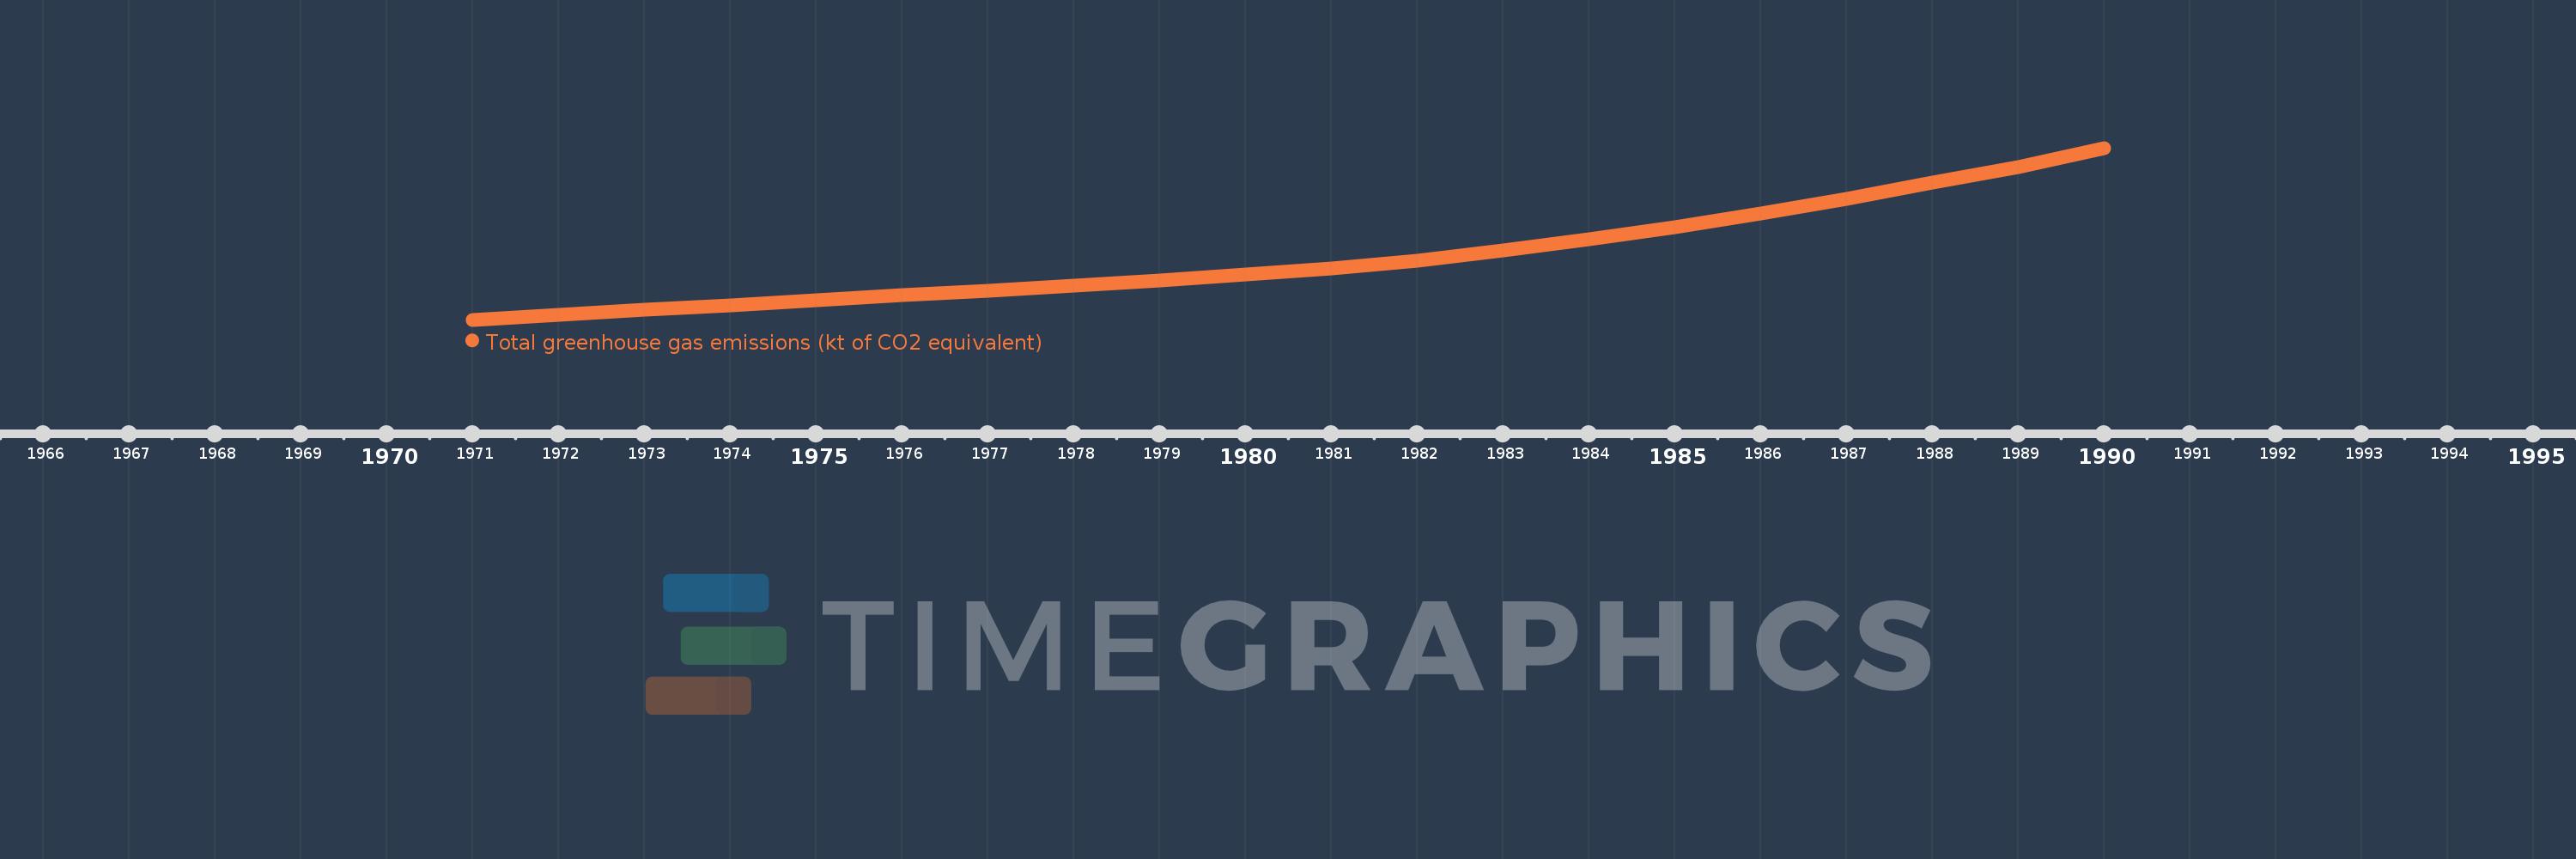
This timeline shows a graph from 1971 to 1990 of Marshall Islands. No data until 1970. Number of actual observations by date: 20.
Source name:
World Development Indicators
Source organization:
European Commission, Joint Research Centre (JRC)/Netherlands Environmental Assessment Agency (PBL). Emission Database for Global Atmospheric Research (EDGAR), EDGARv4.2 FT2012: http://edgar.jrc.ec.europa.eu/
Categories, topics:
Climate Change, Environment
Last updated:
apr 23, 2017
Indicators value changes by year
Meaning:
3.292
Minimum:
2.474
jan 1, 1971
Maximum:
4.697
jan 1, 1990
At the date of observation
Value
Absolute change
Change from the previous value
jan 1, 1971
2.474
+2.474
0.0%
jan 1, 1972
2.539
+0.066
2.66%
jan 1, 1973
2.599
+0.06
2.35%
jan 1, 1974
2.658
+0.059
2.25%
jan 1, 1975
2.727
+0.07
2.63%
jan 1, 1976
2.793
+0.066
2.41%
jan 1, 1977
2.851
+0.058
2.09%
jan 1, 1978
2.917
+0.065
2.29%
jan 1, 1979
2.984
+0.068
2.32%
jan 1, 1980
3.058
+0.073
2.46%
jan 1, 1981
3.143
+0.086
2.8%
jan 1, 1982
3.243
+0.099
3.16%
jan 1, 1983
3.372
+0.129
3.99%
jan 1, 1984
3.516
+0.144
4.28%
jan 1, 1985
3.674
+0.158
4.5%
jan 1, 1986
3.853
+0.179
4.87%
jan 1, 1987
4.042
+0.189
4.91%
jan 1, 1988
4.244
+0.202
5.0%
jan 1, 1989
4.454
+0.21
4.94%
jan 1, 1990
4.697
+0.243
5.46%
Ranking of countries by current statistics by years