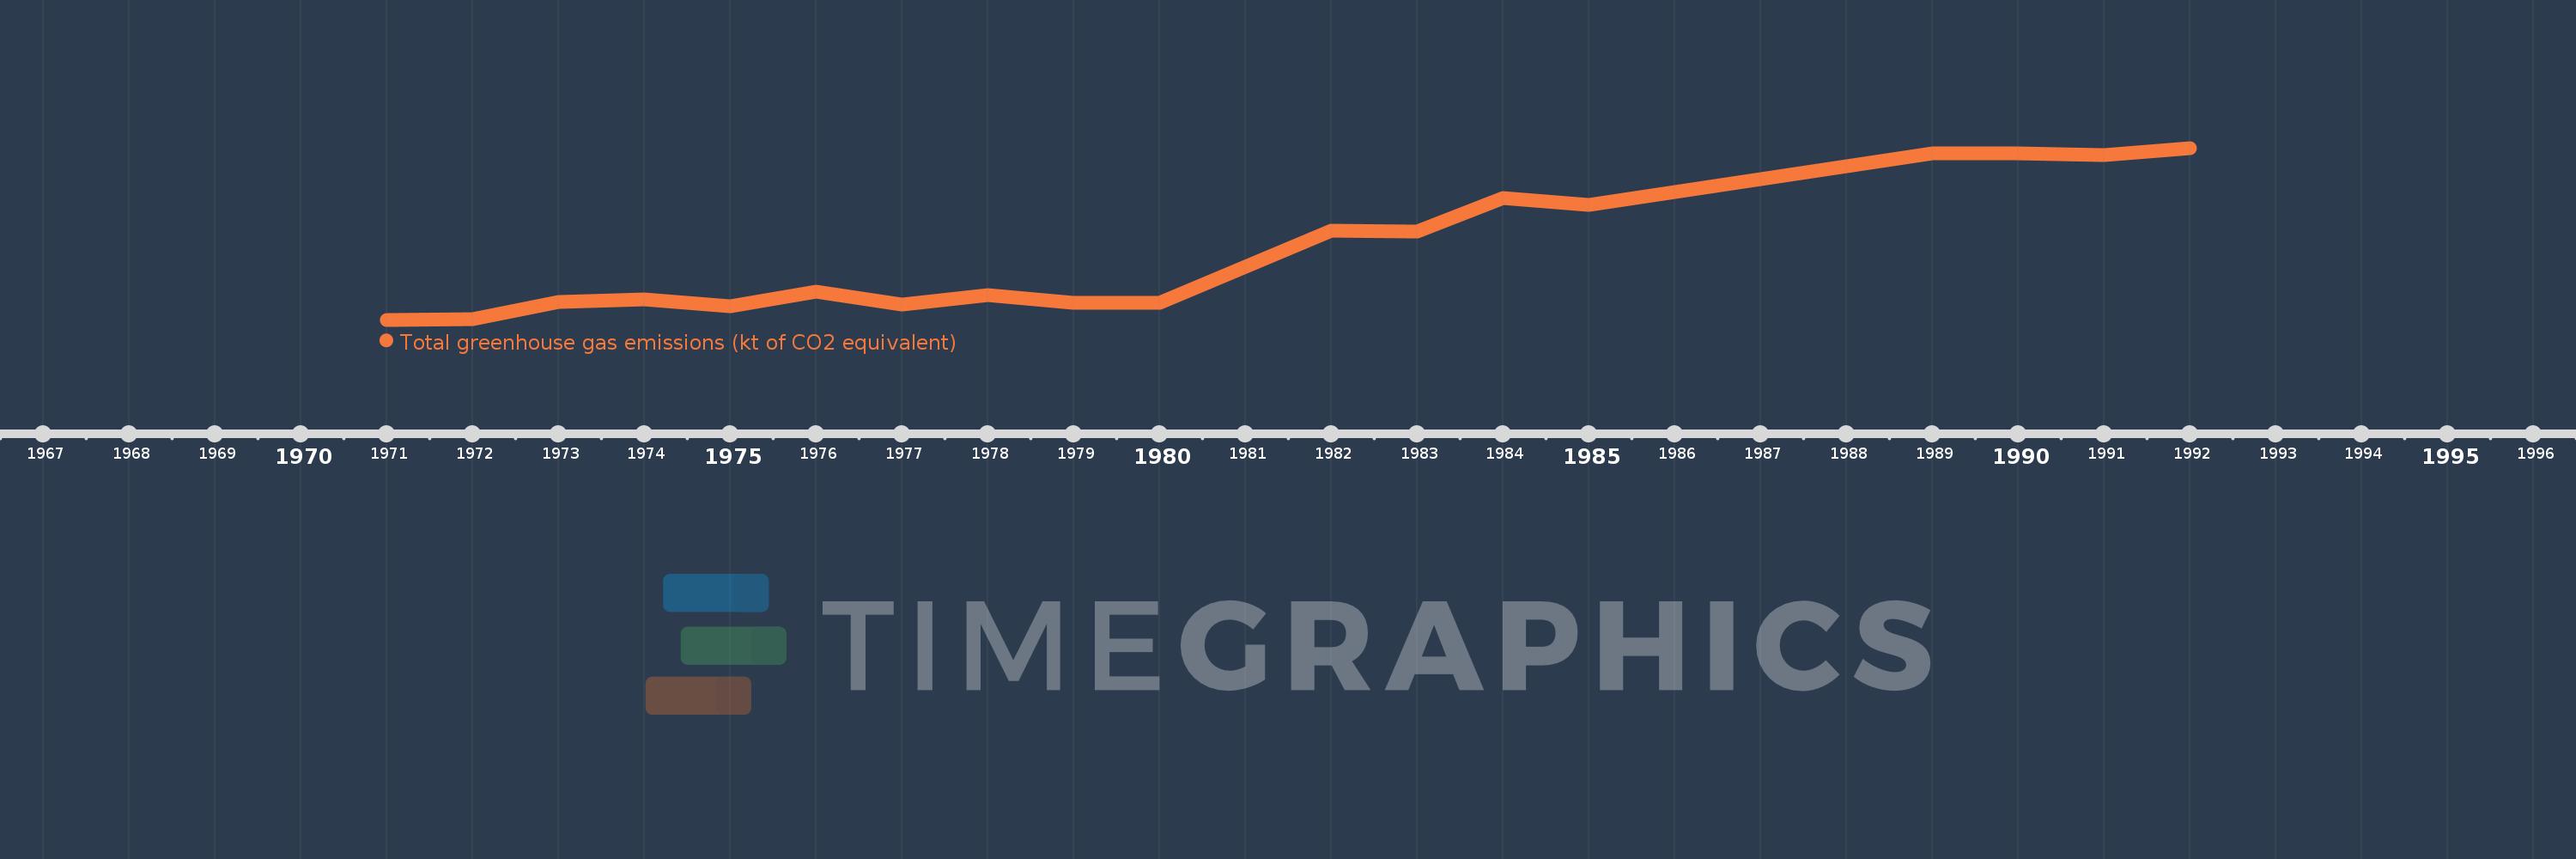
This timeline shows a graph from 1971 to 1992 of Cayman Islands. No data until 1970. Number of actual observations by date: 18.
Source name:
World Development Indicators
Source organization:
European Commission, Joint Research Centre (JRC)/Netherlands Environmental Assessment Agency (PBL). Emission Database for Global Atmospheric Research (EDGAR), EDGARv4.2 FT2012: http://edgar.jrc.ec.europa.eu/
Categories, topics:
Climate Change, Environment
Last updated:
apr 23, 2017
Indicators value changes by year
Meaning:
167.319
Minimum:
73.945
jan 1, 1971
Maximum:
307.346
jan 1, 1992
At the date of observation
Value
Absolute change
Change from the previous value
jan 1, 1971
73.945
+73.945
0.0%
jan 1, 1972
74.523
+0.579
0.78%
jan 1, 1973
97.732
+23.208
31.14%
jan 1, 1974
101.874
+4.143
4.24%
jan 1, 1975
92.761
-9.114
-8.95%
jan 1, 1976
112.44
+19.68
21.22%
jan 1, 1977
94.522
-17.919
-15.94%
jan 1, 1978
107.454
+12.932
13.68%
jan 1, 1979
96.6
-10.854
-10.1%
jan 1, 1980
97.338
+0.739
0.76%
jan 1, 1982
194.489
+97.151
99.81%
jan 1, 1983
193.942
-0.547
-0.28%
jan 1, 1984
239.241
+45.299
23.36%
jan 1, 1985
229.525
-9.716
-4.06%
jan 1, 1989
300.36
+70.835
30.86%
jan 1, 1990
300.261
-0.099
-0.03%
jan 1, 1991
297.396
-2.865
-0.95%
jan 1, 1992
307.346
+9.95
3.35%
Ranking of countries by current statistics by years